Ad Hoc Charting
In Designer, we can effectively make an Ad Hoc Chart where we can pick and choose which pens we want to put on the chart. We can provide this same functionality for an operator in the Runtime by using a special built-in component called the Tag Browser Tree.
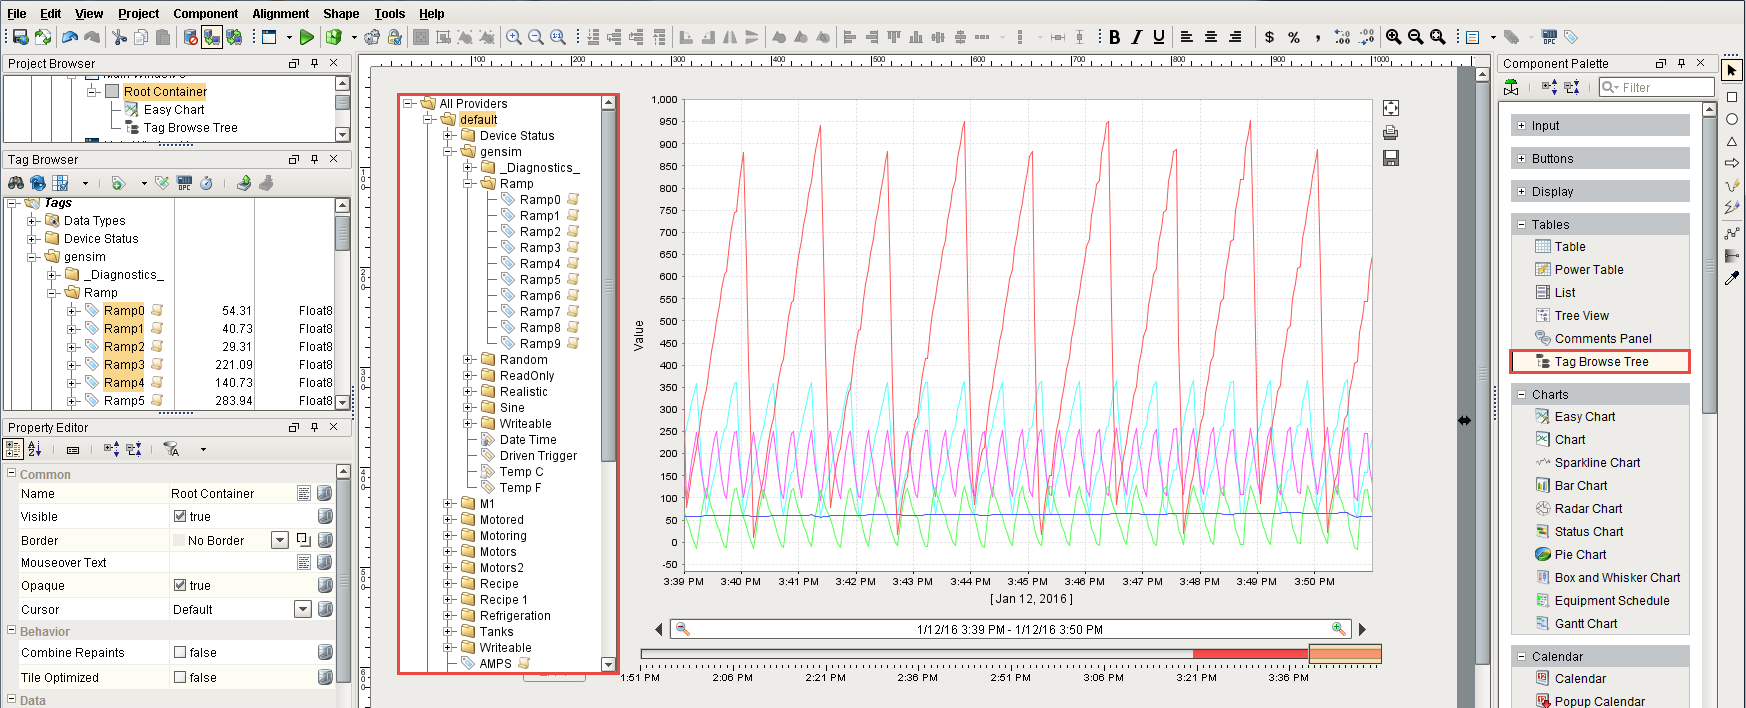
Drag the Tag Browse Tree component from the Tables Tab of the Component Palette to the left side of the chart. The Tag Browser Tree component can give an operator the same functionality as the Tag Browser in Runtime or Preview Mode. Expand the folders to see all the tags in your system. By default, the Tag Browser Tree component shows you all tags even those tags that are not logged in Historian.
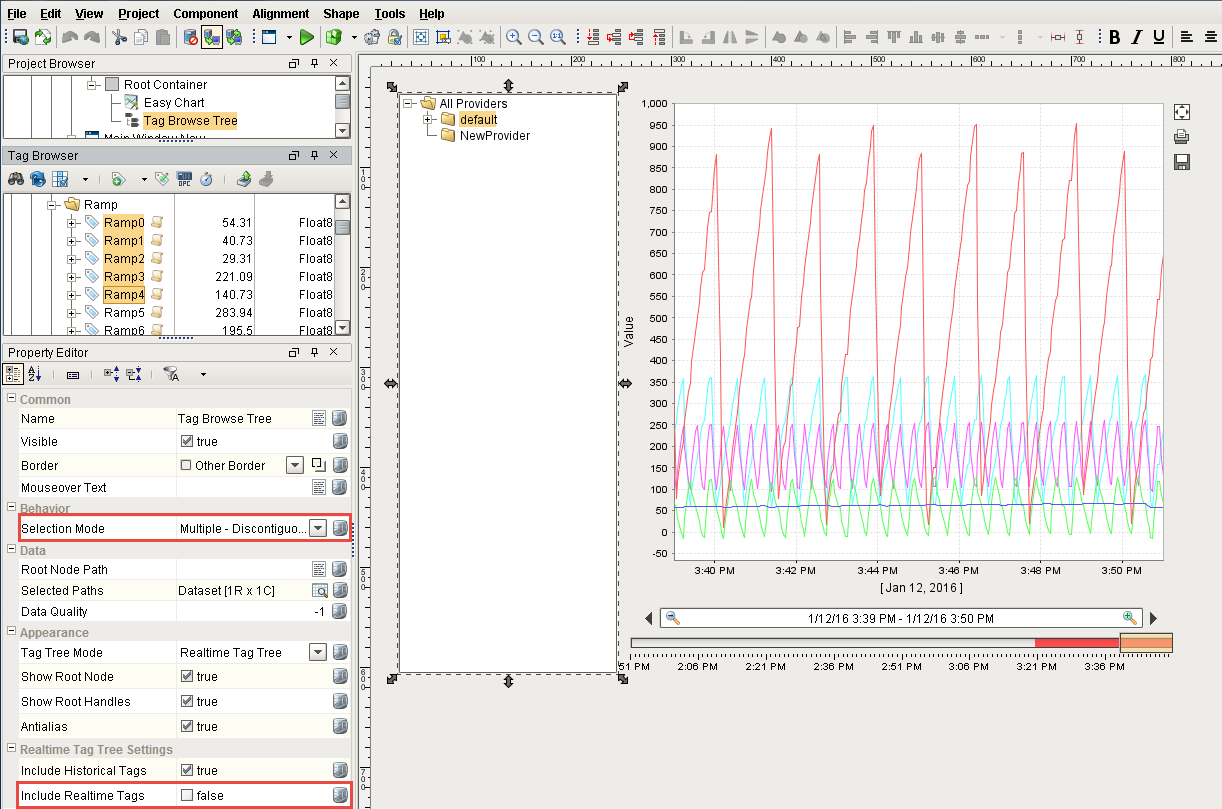
There are a couple of properties worth mentioning that will help you select tags on the Tag Browse Tree component. There is an ‘Include Realtime Tag’ property in the Property Editor on the bottom left that you can uncheck to not include Realtime Tags in the event you only want to see Historical tags. In this example, uncheck ‘Include Realtime Tags.’ There is also another property called ‘Selection Mode’ where you can make a single tag selection or you can select multiple tags. Select ‘Multiple – Discontiguous’ from the dropdown.
By adding the Tag Browse Tree component on the window, each of the components knows exactly how to work together. Format the Tag Browse Tree component, pens and graph so you can see all three nicely on the window. Click Save and go into the Runtime or Preview Mode.
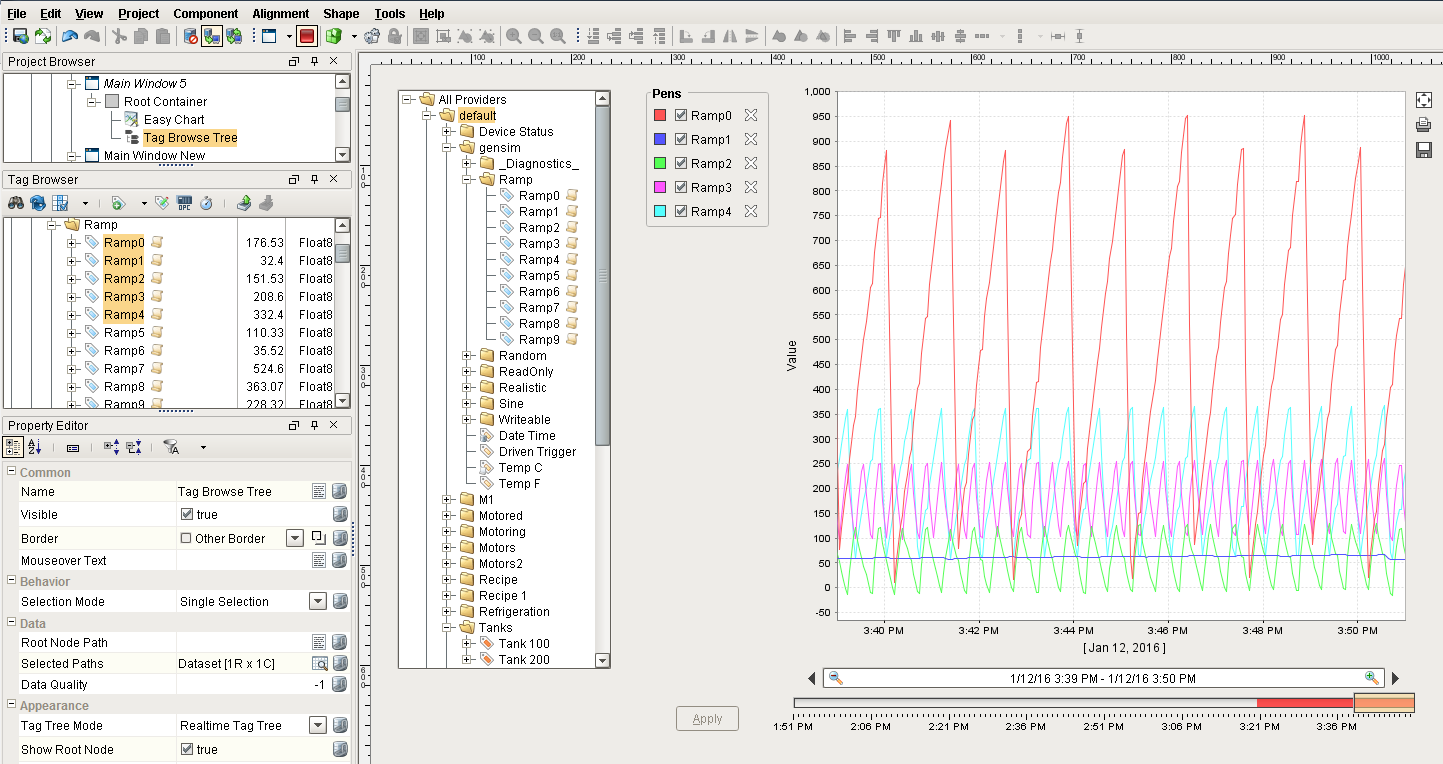
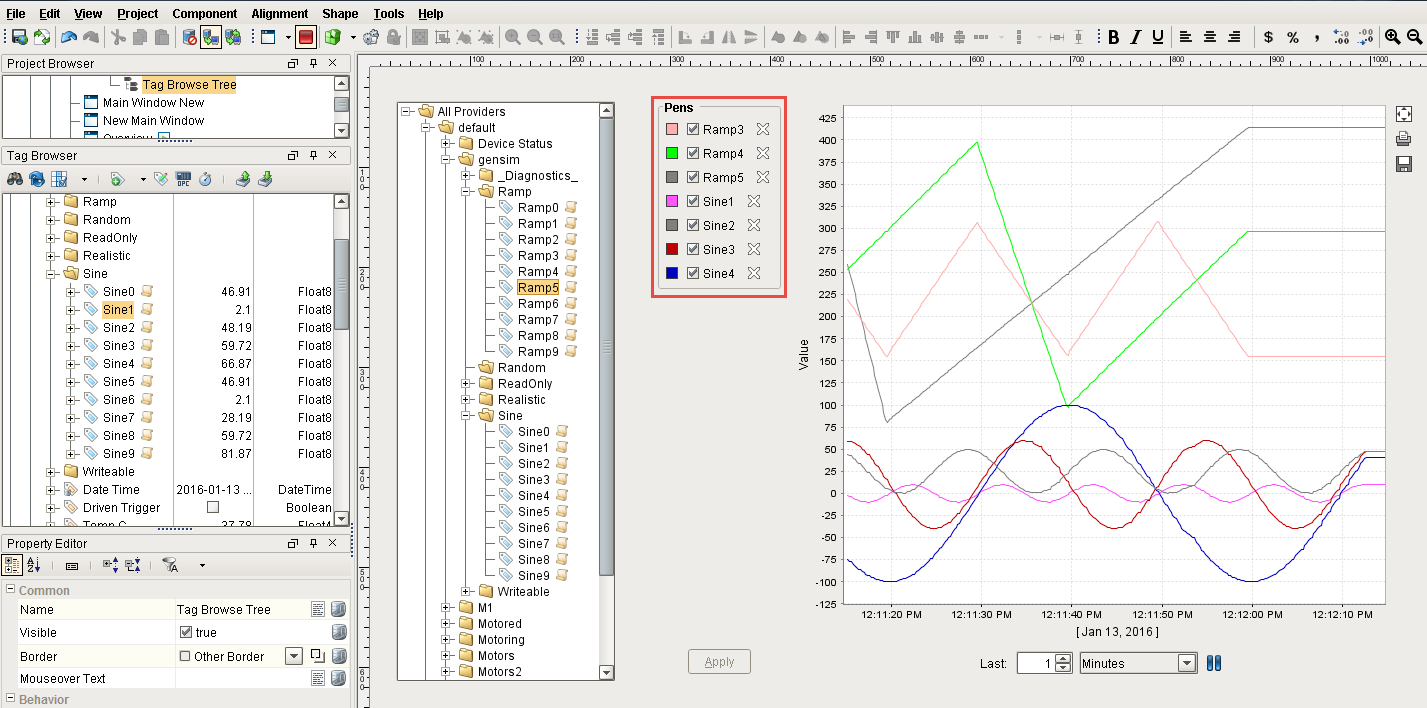
Now, you can browse for tags in the Tag Browse Tree. Select one tag or multiple tags and drag them on to the chart to make an Ad Hoc Chart. In this example, the ‘Ramp’ and ‘Sine’ tags were randomly selected to create the following Ad Hoc Chart.
You can press the ‘X’ icon to the right of any of the pens to remove a tag from the chart. You can also remove all pens and go back to an empty chart, and pick and choose which of the tags you want to drag on to the chart, thus, creating an Ad Hoc Chart.
When working in the Designer, whatever pens you have on your Easy Chart when you saved, the same pens will also be displayed on the chart when the client is opened.
You may have multiple axes set up for your Easy Chart, but when dragging tags from the Tag Browse Tree component to an Easy Chart there is no way for the user to set which axis to use. Because of this limitation, any tag that is added in this way will attempt to match their Engineering Units property to an axis on the chart. If no match is found, the default axis will be used.