Report Data Basics
The Data Panel is an incredibly powerful tool for gathering data for your reports. In this section we'll go through some of the ways we can use the tools in the Data Panel to collect data from any source you may have.
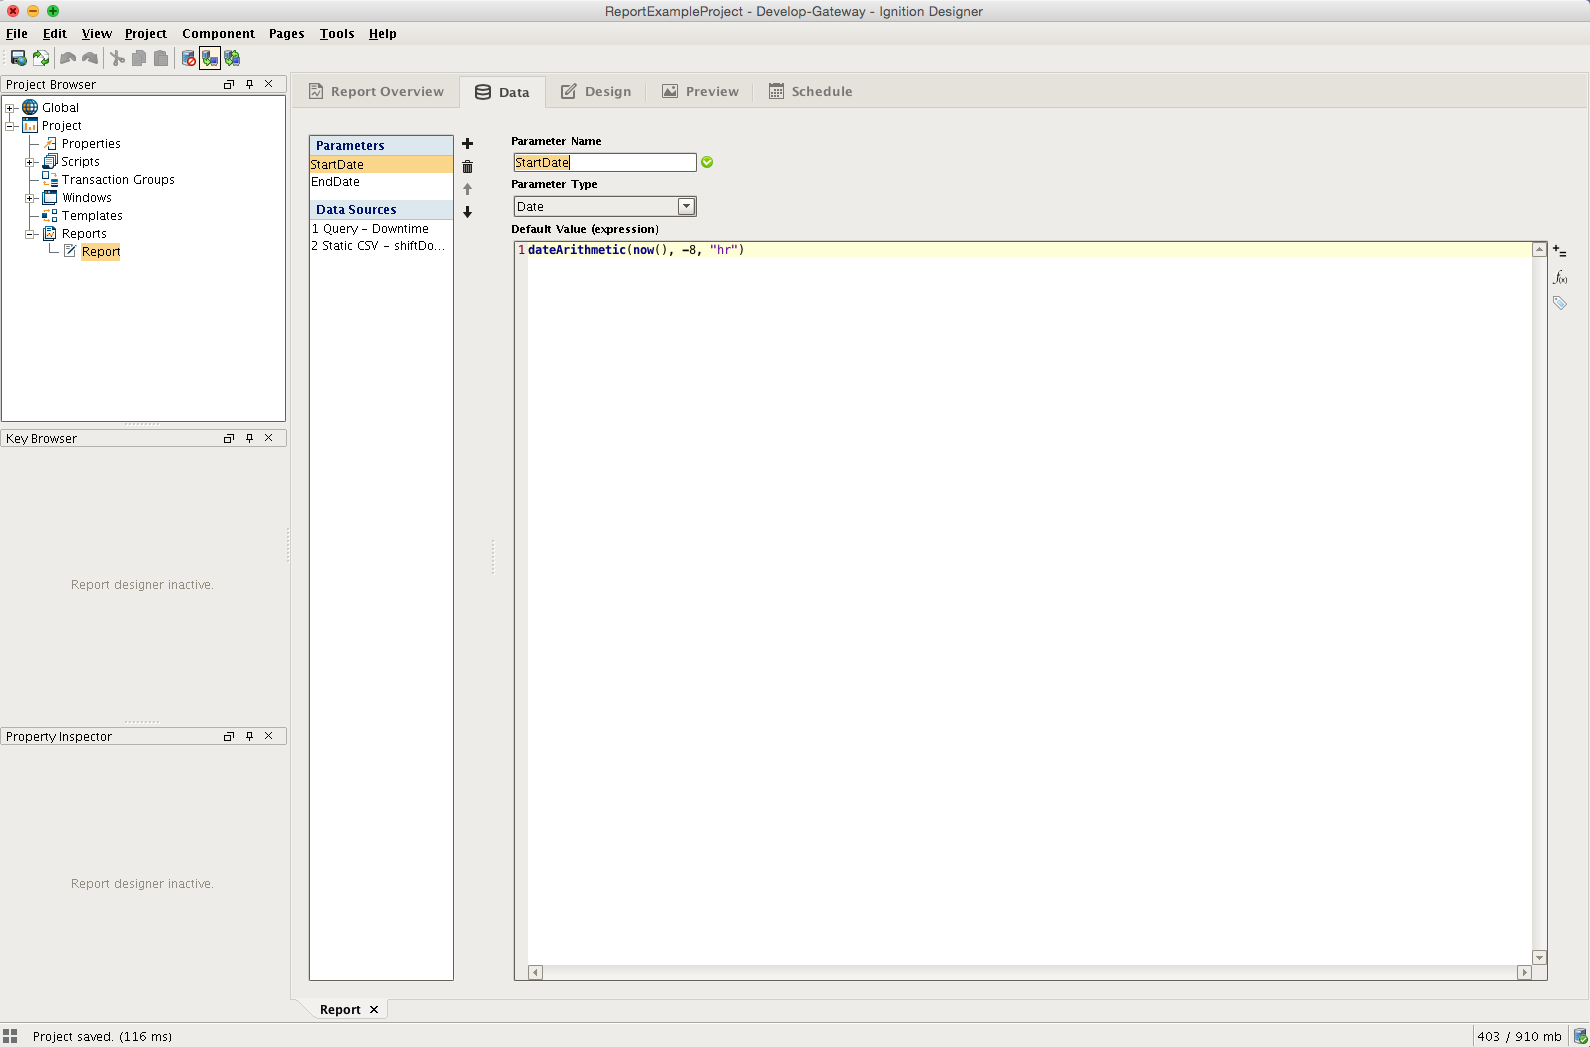
Parameters
As we covered in the overview, the Data Panel is pretty simple at first glance. When creating a new report, there is an empty list of Data Sources as well as pre-made Parameters. Parameters are Ignition Expressions. These parameters resolve at report execution time and provide a convenient way to dynamically specify content for your report. These expressions are expected to resolve to specific types.
The Parameter Types available in the ComboBox will be familiar to anyone who has used Expressions, and include:
-
Date
-
String
-
Long
-
Double
-
Boolean
-
Dataset
What are Parameters Useful For?
Parameters share some similarities to Custom Properties in Vision components in that they allow an Ignition user to specify dynamic data to be used in reports at runtime. For example, a manufacturer may want to generate reports for the active production lines every Monday morning, but you don't know ahead of time which production lines will be running. We can create a parameter called activeProductionLines and use an expression or tag value to determine which lines were active, and only use the parameter in a SQL Query datasource to only include data from active lines.
Parameters can be declared with an empty (null) value. In this event, it can be fed values from the Vision Report Viewer component, or in the Report Scheduling panel. Similar to how custom properties work with the old Report Component, the new Report Viewer can use parameters to bind to data through Ignition Bindings. If a parameter is supplied a default value in the Report Data panel (we call these default parameters), that value will be automatically be supplied to the Report Viewer component. If a parameter has no default, the Report Viewer and Preview Panel will notify the user that a parameter is undefined. It is important to note that both Scheduled Report and Vision component parameters take precedence over default parameters. So any default parameter can easily be overridden while also providing a baseline value.
The Parameter Editor
Developer Tip
Give your Data Keys readable names that say something about the table or data they represent. It will make it easier to build meaningful reports!
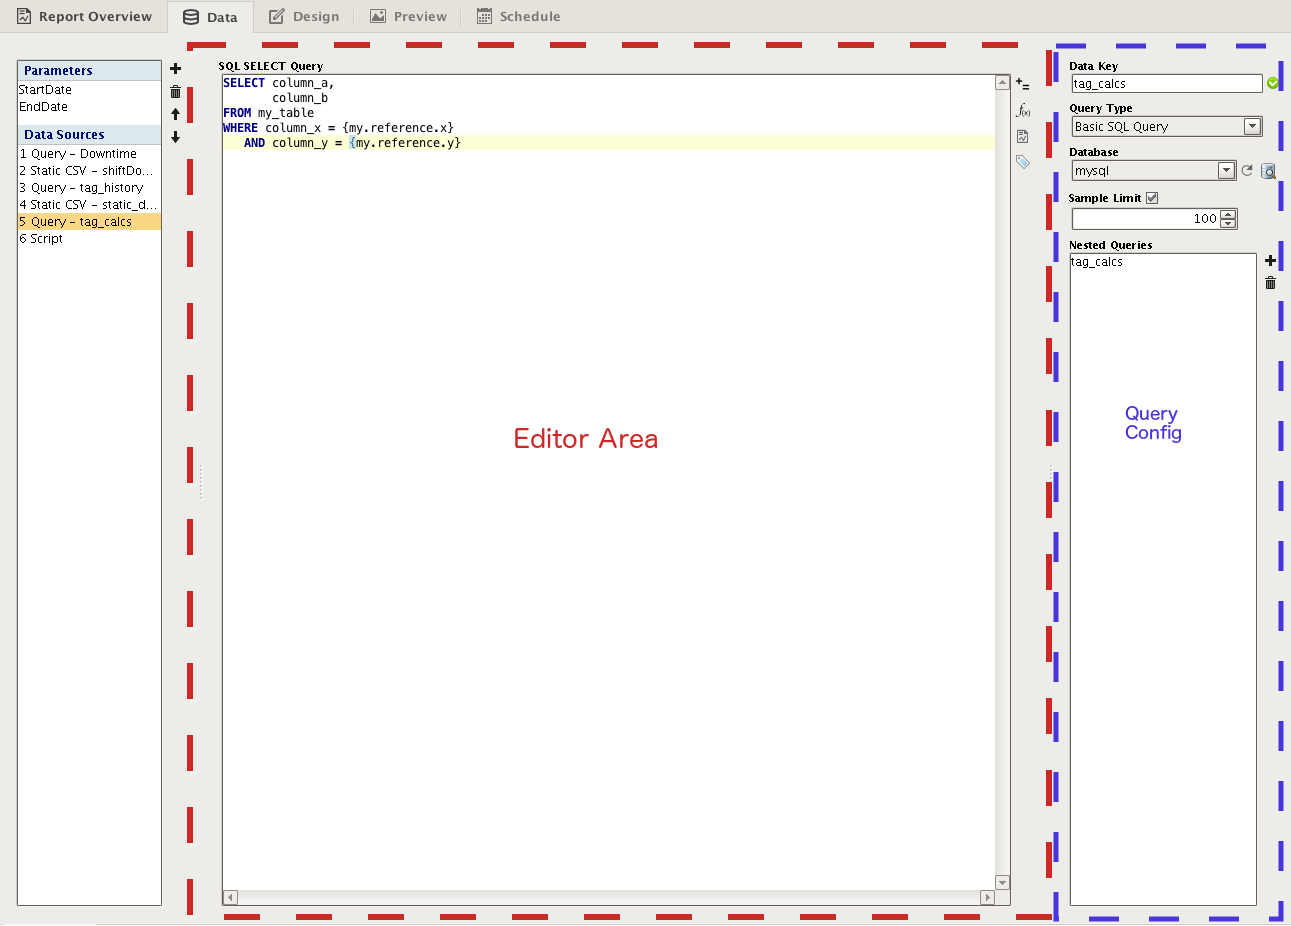
A Query Data Source Panel
Data Sources
Data Sources are the primary means of getting data out of where it lives and into a report. There are seven Data Sources included in the Reporting Module. There are five Query types, a Script data source and Static CSV. Each data source offers a unique method of collecting (or amending in the case of Script Source) data. Aside from the Script datasource, all will require you to specify a Data Key. The Data Key is a unique identifier that represents the top-level of the data collected through this source – think of it as the label for the data source, or as the parent node of your source's collected 'data tree'. When your report is generated, the data collected under this identifier is passed to the reporting engine, which utilizes this identifier to appropriately place your data in the final report. We'll take a closer look at how to configure and reference this data in the Reporting Workflow section.
Query Datasources
Query Data Sources are the foundation on which most reports will be built. We have five query sources --
-
SQL Query
-
Basic SQL Query
-
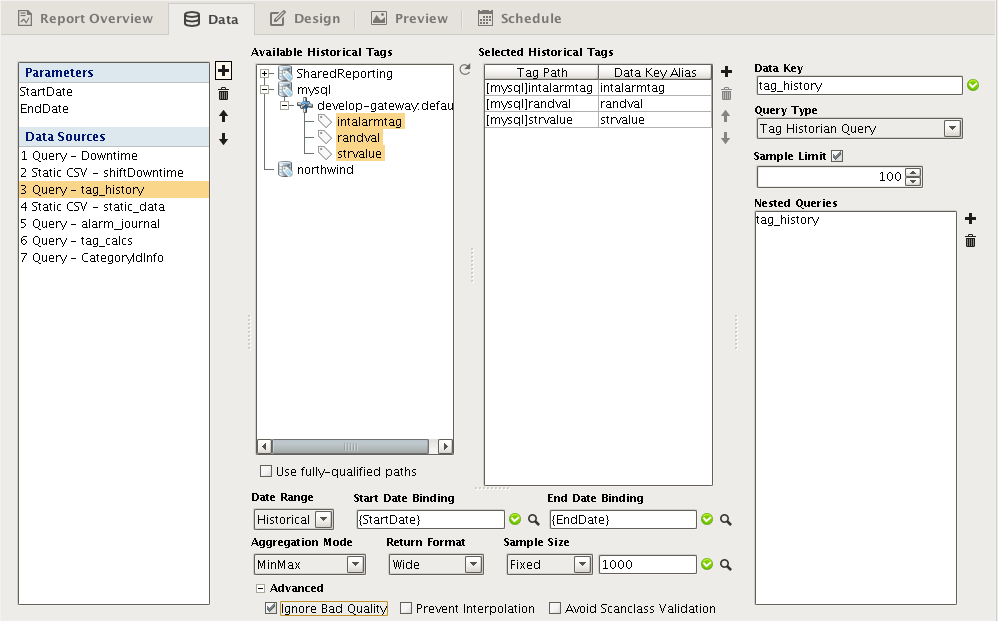
Tag Historian Query
-
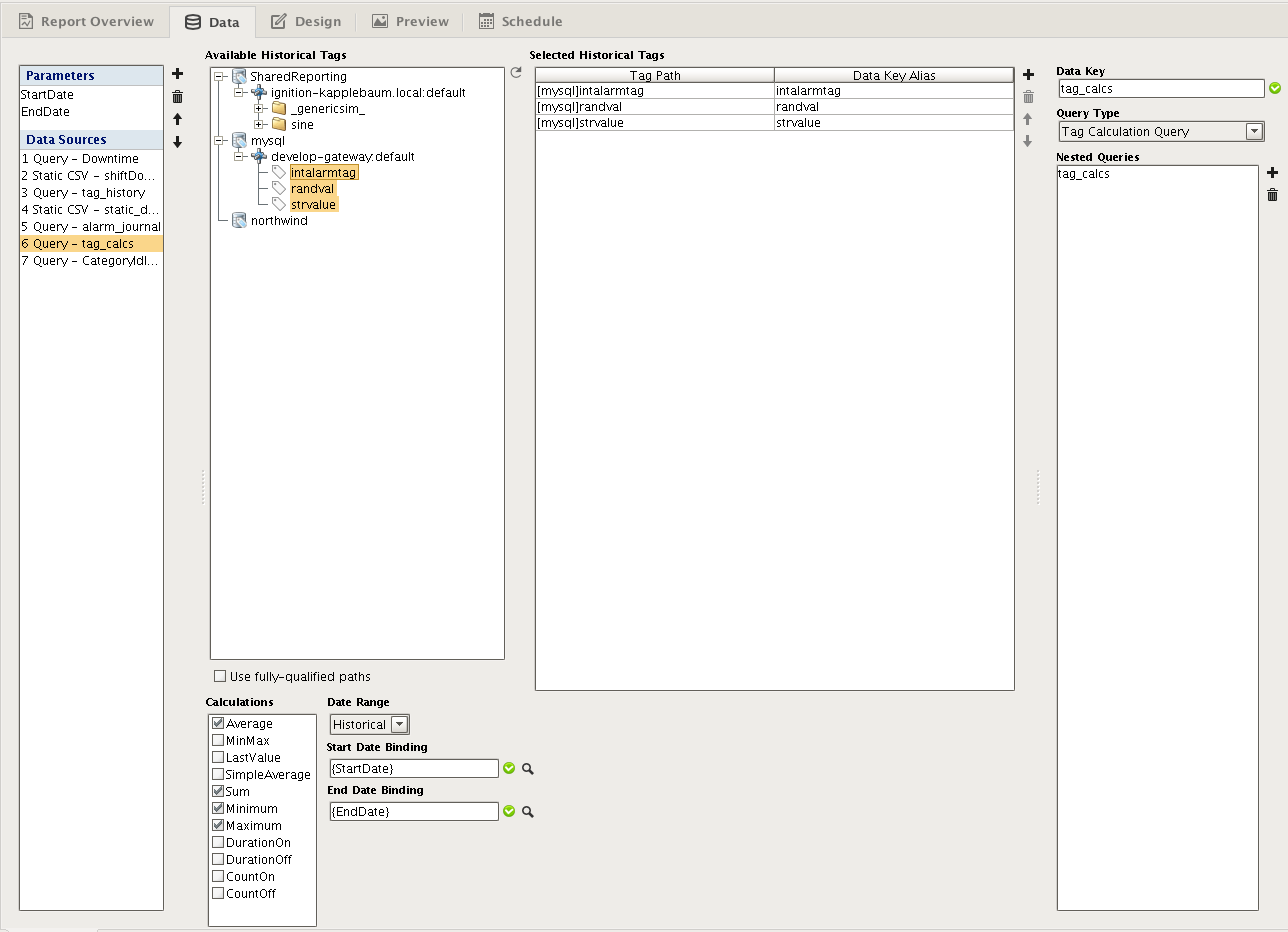
Tag Calculation Query
-
Alarm Journal Query
Queries share some common features in the UI, and in the fact that they all return what is essentially a Dataset. If you take a look at the image on the left, you'll see we outlined two main areas of the Basic SQL Query data source type. By default the largest part of any Query panel is taken up by the central Editor Area. This space is tailored for each query type. On the right, we have a "Query Configuration" area. In the screenshot, there are options for the Data Key, Query Type, Database, Sample Limit and Nested Queries. Of these, Data Key, Query Type and Nested Queries are shared among all Queries, while Sample Limits are conveniently available in SQL query types. Here is some brief information on each:
-
Data Key - The identifier we will reference when we design our reports. The Data Key needs to be unique, can not contain special characters (spaces, underscores, dashes are allowed), and must start with a letter. We have added a convenient validator to help detect poor data keys.
-
Query Type - gives you a convenient place to change the type of query
-
Nested Queries - This is one of the most powerful aspects of the new Reporting System. We will get into more detail on how they work in the next section, but in short: nested queries allow you to run queries that are dependent on return values from other queries. Utilizing a Parent-Child relationship, you a child query will execute for each row of its parent, and the parent's columns can then be referenced in the child.
-
Sample Limit - Allow you to choose to limit the number of rows returned from a query when a report is being generated in the Preview Panel, and when data is sampled for the purposes of generating Data Keys in our Designer. If supported by your database, this makes it much easier to craft and preview deep query structures without the overhead and wait-times of long-running queries.
Queries allow you to pull data from any connected database, historian and even alarm history.
Query Types
Here is a brief rundown on each query type.
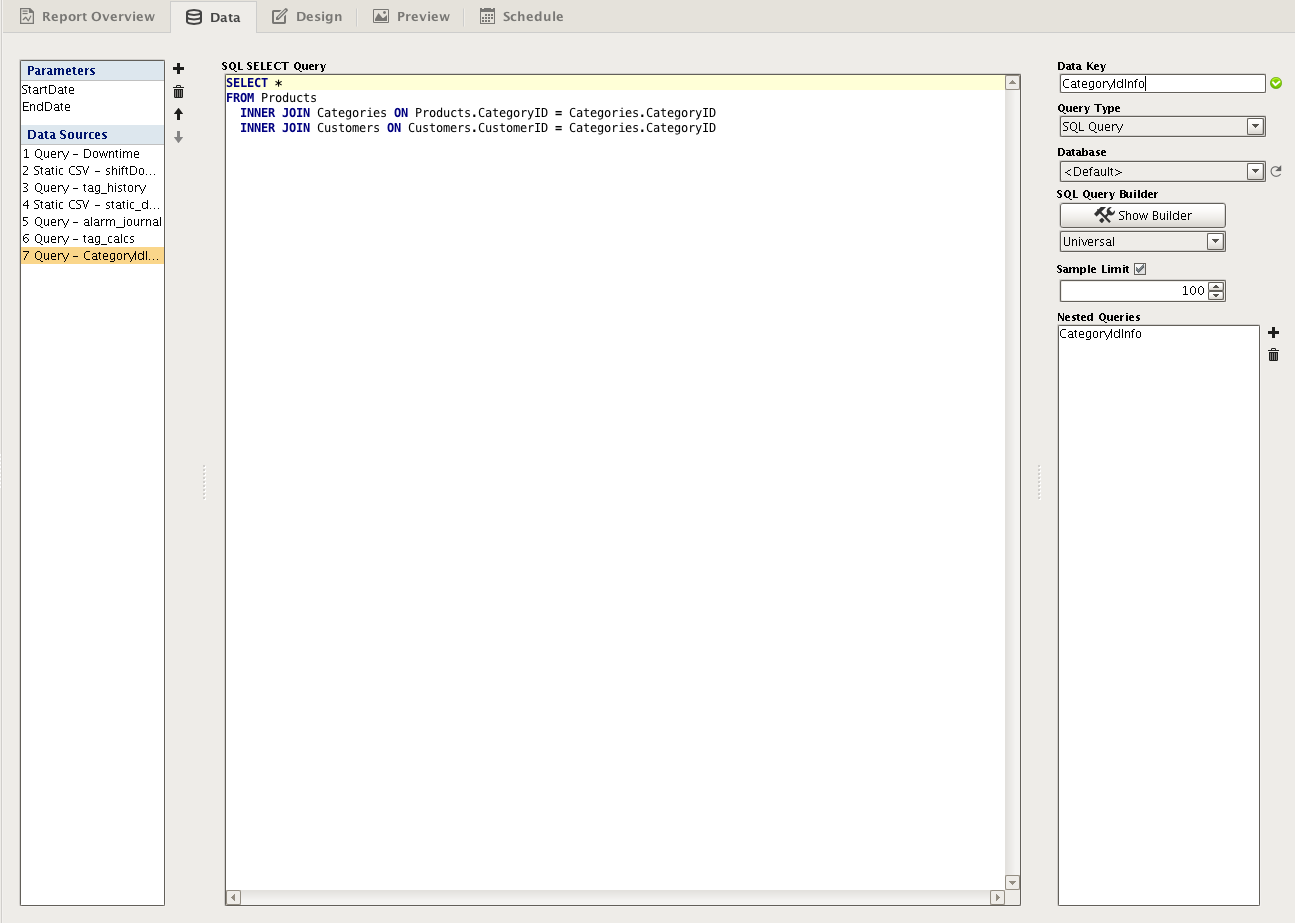
SQL Query
The SQL Query allows you to craft parameterized queries that run as a prepared statement. In addition, it also features the new Query Builder, which is a powerful Drag-and-Drop query building GUI that allows you to make complex queries from your connected databases. As Prepared Statements, these queries are more resistant to SQL injection offering additional security over basic queries. Craft your query, and for each variable you wish to evaluate, substitute a '?' and a new editor will be added below in which you can add static values, expressions, or references.
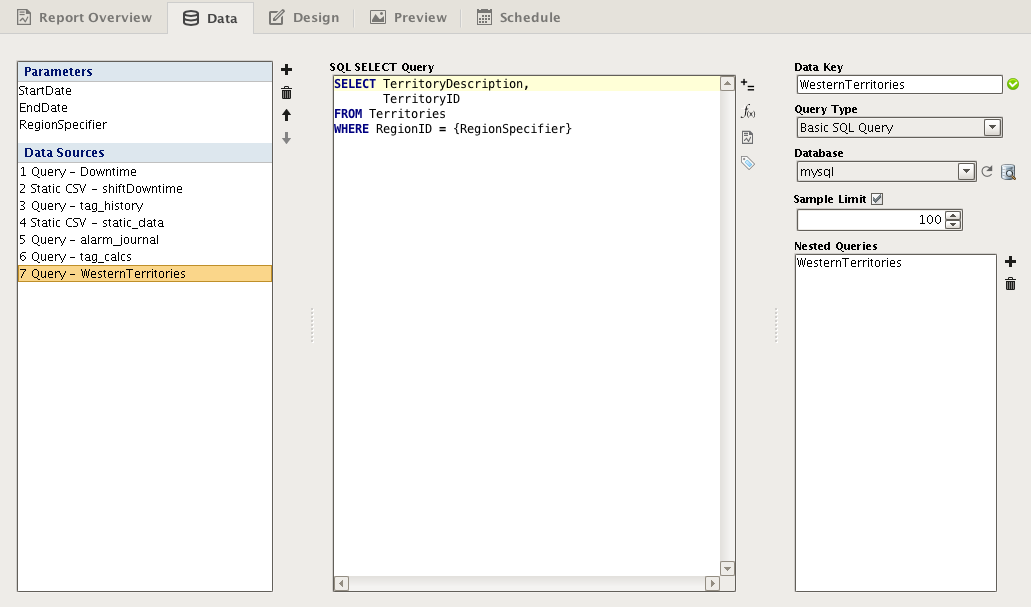
Basic SQL Query
This query type is the common type historically seen through much of Ignition. You can write queries which include tag path references, expressions, or report parameters which resolve at run time.
Tag Historian Query
Provides a simple way to query data from Tag Historians. Utilizing a user interface familiar to Tag Historian users, you can collect data from Historical tags for specific date ranges, using aggregations, or for fixed sample sizes.
Tag Calculation Query
A new part of the Ignition Platform in 7.8, Tag Calculations is an extensible part of the API that provide values from calculations run against Tags. You can easily run several calculations on your historical tags, including Average, Sum, Maximum value, and many more.
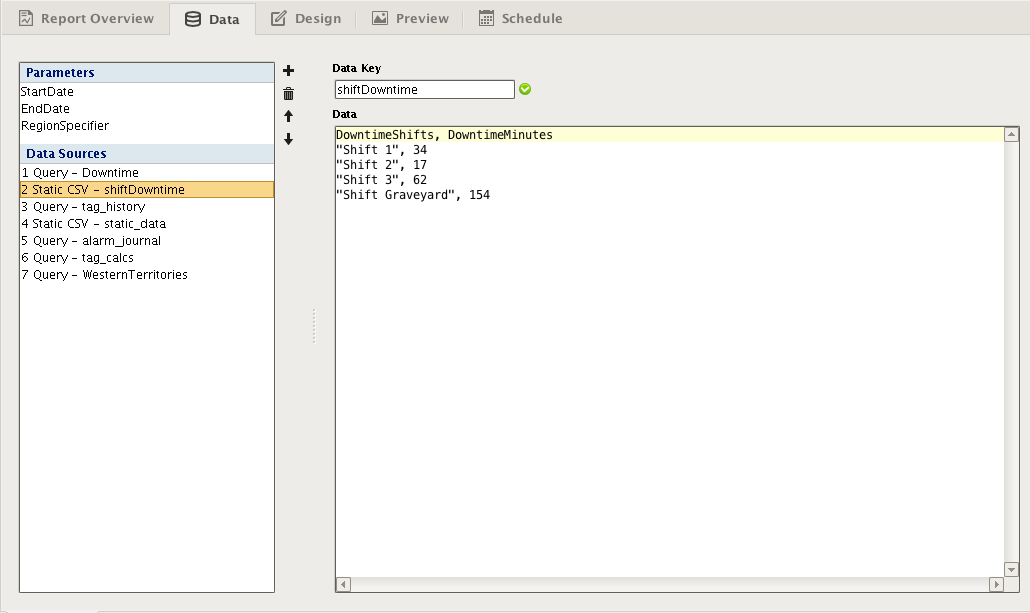
Static CSV Datasource
The Static CSV data source is exactly what it sounds like – an opportunity to provide your report with a static set of CSV data. We found this source to be helpful when trying to design reports without having database access. You can generate or create a simple CSV model of some of your data and test the visual layout of your report. Alternatively, it also provides a means of adding data from, for example, Excel or Access CSV exports. While not the most powerful datasource, it does make it easy to add external data.
Script Datasource
Always a popular choice for power users, a script can be used to collect data that is otherwise difficult to get through the Query types. Whether you need to pull data from files, crunch data collected from Queries using specialized Python libraries, or alter datasets from converted Reports, scripting is always a flexible way to accomplish your goals. In general, we recommend using alternatives when they exist, but if all else fails, a script will provide the flexibility you need to get data to the reporting engine.