Report Bar Chart
The  component can be used to add bar charts to a report.
Usage
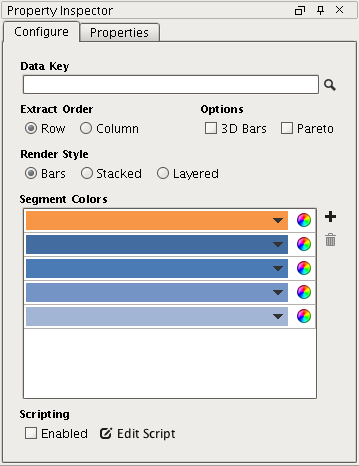
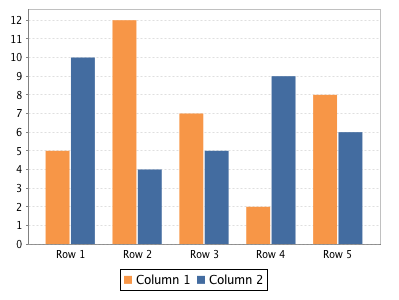
To create a bar chart, simply drag the button from the Report Palette and drop onto your page, Table Row, or other shape capable of containing children. Bar charts are quite easy to configure, requiring a data source whose first column generally contains the name or identifier the bar represents, and the following one or more columns represent some numerical value to be plotted.