Query Browser
The Database Query Browser Panel
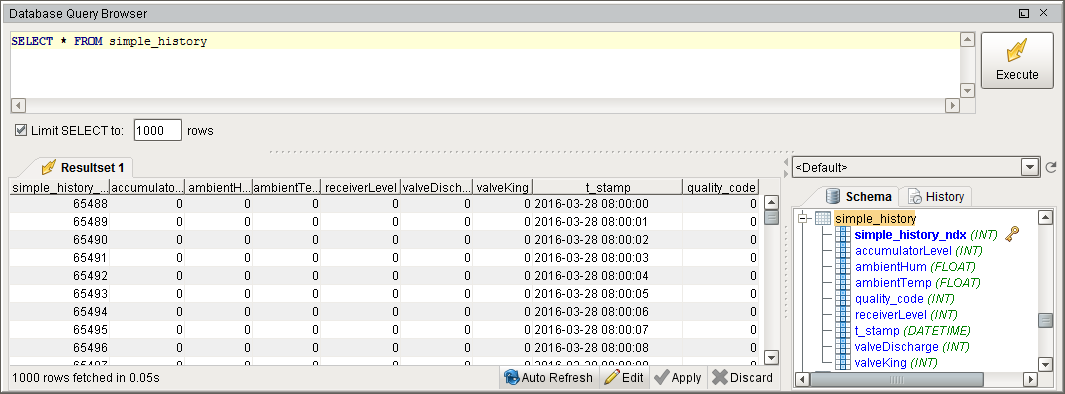
The Query Browser is a very convenient tool that lets you make simple edits in a database table, and interact with all of the databases that Ignition is connected to, for example running queries and browsing tables and schemas. Because Ignition is so heavily integrated with databases, it is very common in the course of project design to need to inspect the database directly, or to experiment with a SQL query to get it just right.
Using the Query Browser
Using the Query Browser is pretty simple, and it is easy to seach through and manipulate your database tables with it. On the right will be a list of tables in the currently selected database connection. The tables can be expanded to see a list of columns and their datatypes that are in that table. Double clicking on the table name will auto populate the text area with a basic "SELECT * FROM database_name", or a query can be manually typed into the text area. After executing a query, you should see the results of that query in the resultset tab.
You can have multiple resultsets by right-clicking on the resultset tab and selecting New Tab. This will allow you to pull back data from multiple tables, and flip between tabs to compare data.
To Edit the Database using the Query Browser
-
In the Query Browser, first select some data with a select query. You should see the table's data in the resultset tab.
-
Click Edit to change the values in the Resultset, and click Apply to commit your edits or Discard to back out.
Note: You can Edit the values only when the table is displaying the id numbers (table's primary keys), otherwise you can not Edit the table values. -
To verify the changes you made, Execute the select query again to verify that the data that was added or removed comes in properly.
You can also modify the data in the database using UPDATE, DELETE, or INSERT queries.
To Monitor the Database using the Query Browser
The Query Browser also lets you monitor a database table for changes by using the Auto Refresh button. This is often convenient when designing Transaction Groups. As the group runs, you can view the table that it is targeting with auto-refresh turned on to watch how the group is altering the table.
To Edit Data Graphically
If you have a simple (no join) query, you can edit data directly through the viewer by clicking the Edit button at the bottom right of the results. This allows you to double-click a cell and type directly into it. Click the Apply button when you are done editing. Don't forget to set you Communication Mode to Read/Write before hitting that Apply button.
Similar Topics ...