Scripting Console
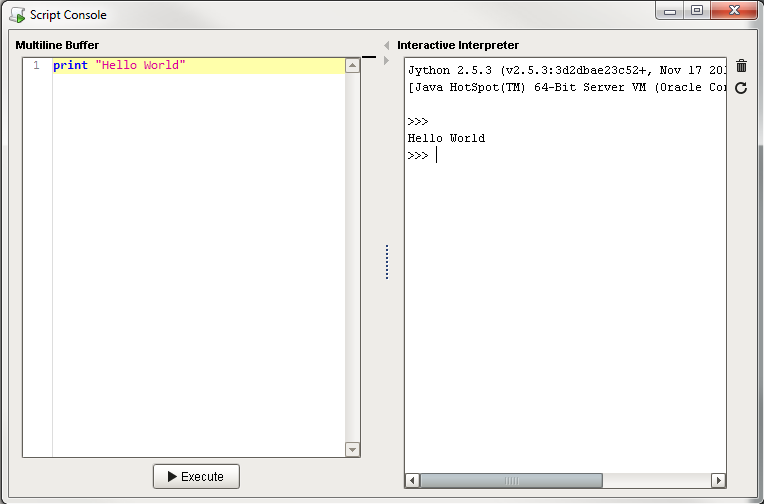
The Script Console is a live python terminal that is only accessible in the Designer. It is a great way to very quickly test a script as it does not rest on a scripting event or specific component.
The Script Console can be opened via the Tools > Script Console menu. It consists of two parts: a Multiline Buffer, and an Interactive Interpreter. Code can be typed into both sides.
Due to the scope of the Script Console, it can not interact with components on a window.
It can call Project and Shared scripts. If a Project or Shared script was recently added, then the conosle will need to be reset before they may be called. This can be accomplished by clicking on the Reset button.
Gateway scoped information will not appear in either the Script Console or Output Console. Instead they will output to the wrapper.log file. Alternatively system.util.getLogger() will send messages to the Gateway Console, and is a preferred method of troubleshooting gateway scoped scripts.
Features
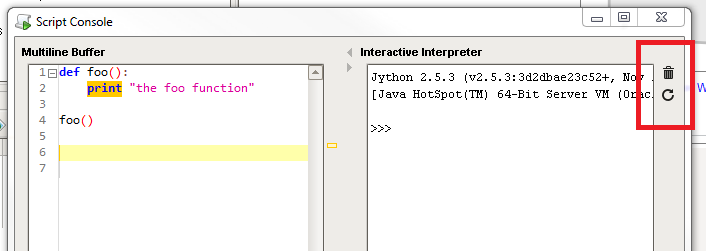
There are two buttons located on the right side of the console.
-
Clear
 clears the text from the Interactive Interpreter.
 -
Reset
 clears the text and deletes all user defined objects (variables and functions) from the interactive Interpreter.
Multiline Buffer
The Multiline Buffer, located on the left side of the Script Console, allows for multiple lines of code to be entered and then executed by clicking on the  button. All print statments will output to the Interactive Interpreter. Supports code folding for function definitions and comments.
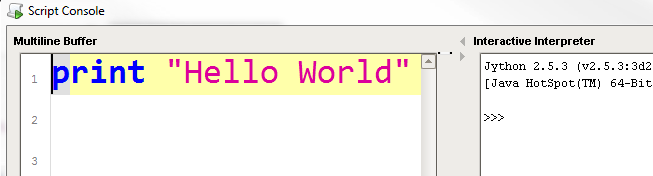
Font Size Adjustment
The Font size in the Multiline Buffer can be adjusted by holding Ctrl and scrolling the mouse wheel
Right Click Menu
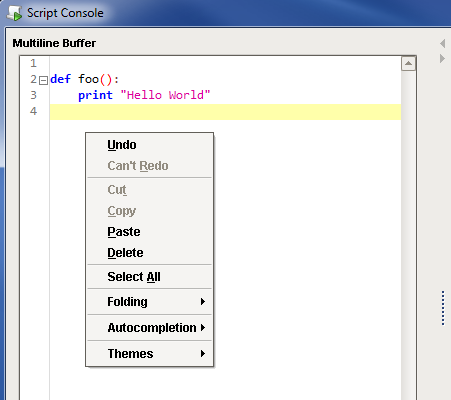
Right clicking on the Multiline Buffer opens a menu. Most of the options in the menu are self explanatory. The rest are defined below:
|
Folding |
|
|
Name |
Description |
|
Toggle Current Fold |
Expand or collapse the fold where the text cursor is located. |
|
Collapse All Comments |
Collapse all instances of multi-line comments. Only contiguous comments are collapsible. |
|
Collapse All Folds |
Collapse all expanded folds. |
|
Expand All Folds |
Expand all collapsed folds |
|
Autocompletion |
|
|
Name |
Description |
|
Automatic Activation |
Determines if the Autocompletion window to automatically appear. When set to true, the window will appear after a second of inactivity once at least "system." has been typed. When set to false, the window can still be brought up manually by pressing Ctrl+Space |
|
Show Description Pane |
Determines if the Description pane should appear in the Autocompletion window. |
|
Themes |
|
|
Name |
Description |
|
Default |
Uses the default theme with light background, dark characters |
|
Dark |
Uses a dark theme with dark background, light characters |
|
Visual Studio |
Uses a theme reminiscent of Visual Studio. Light background, dark characters |
Find/Replace
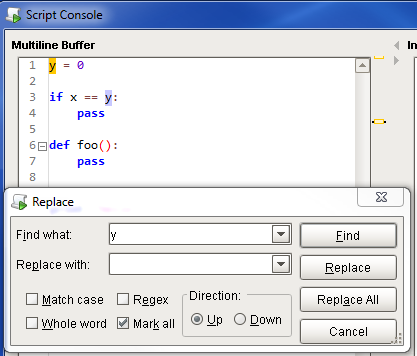
Pressing Ctrl+R while the text cursor is in the Multiline Buffer opens a Find and Replace window. This will search for instances of text throughout the Multiline Buffer, and allows the user to replace all or some instances with new text.
Keyboard Shortcuts
The following shortcuts apply only to the Multiline Buffer
|
Key(s) |
Description |
|
Ctrl + </> (on the number pad) |
Collapse all folds |
|
Ctrl + <*> (on the number pad) |
Expand all folds |
|
Ctrl + <-> (on the number pad) |
Collapse the fold on the same line as the text cursor |
|
Ctrl + <+> (on the number pad) |
Expand the fold on the same line as the text cursor |
|
Ctrl + <Space> |
Open Autocompletion window. By default, the window will automatically open once "system." has been typed |
|
Ctrl + <R> |
Open Find/Replace window |
|
Ctrl + <Mouse Wheel Scroll> |
Increase and decrease the font size |
Interactive Interpreter
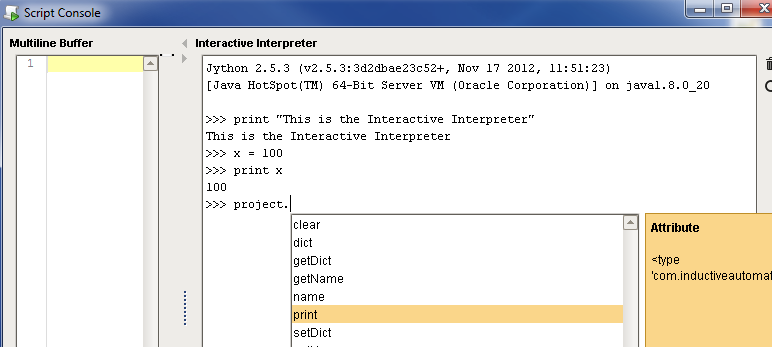
The Interactive Interpreter is located on the right side of the Script Console, and allows you to run a single line of code at a time. Code is executed from the Interactive Interpreter by pressing the Enter key. Print statements from both sides of the Script Console will appear in the Interactive Interpreter.
The Autocompletion window available in the Interactive Interpreter has access to the current working environment, so items such as Project and Shared scripts will appear. This will automatically appear, but can be called manually.
Keyboard Shortcuts
The following shortcuts apply only to the Interactive Interpreter
|
Key(s) |
Description |
|
Ctrl + <L> |
Clear the Interactive Interpreter. Functionally the same as clicking the Clear button |
|
Ctrl + <R> |
Reset the Interactive Interpreter. Functionally the same as clicking the Reset button |
|
Up arrow |
Cycle backward through command history |
|
Down arrow |
Cycle forward through command history |
|
Ctrl + <C> |
Keyboard interrupt |
|
Ctrl + <Space> |
Open Autocompletion window. By default, the window will automatically open once "<object>." has been typed (assuming a valid object such as "system" or "project" if a Project script has already been defined |
|
Ctrl + <A> |
Move the text cursor to the start of the line. Similar to pressing the Home key |
Output Console
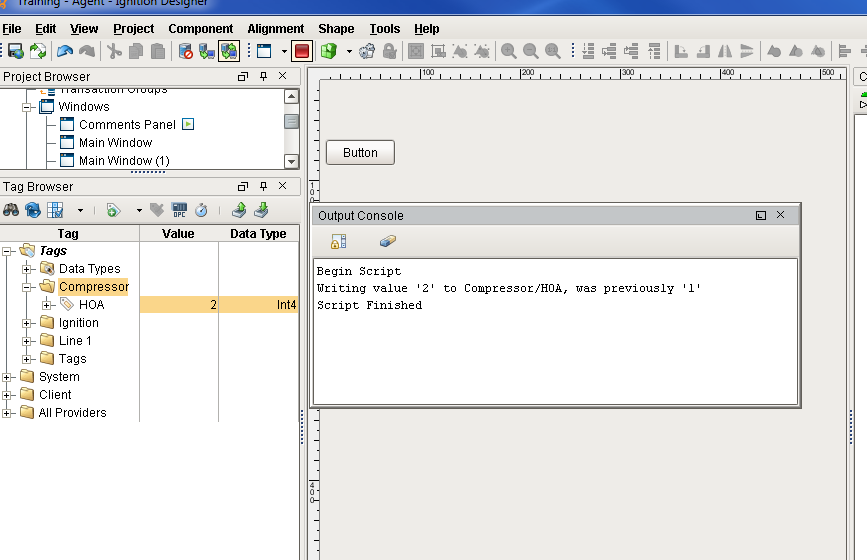
The Output Console is the script-writer's best friend. It is a dockable panel, and can be opened via the Tools > Console menu or the Ctrl-Shift-C keyboard shortcut.
The output console is most frequently used to test and debug Python scripts on components in Ignition. By using the print keyword in your script, you can observe the inner workings of your script as it executes. For example, if you executed the following script:
# A function that intercepts tag writes, printing out the previous value firstdef writeToTag(path, value): prevValue = system.tag.getTagValue(path) print "Writing value '%s' to %s, was previously '%s'" % (value, path, prevValue) system.tag.writeToTag(path, value) writeToTag("Compressor/HOA", 2)
It would print the following to the console:
Writing value '2' to Compressor/HOA, was previously '0'Note: The output console is also available in the Vision Client from Help > Diagnostics.