Charts Inside of Tables
When a table row is made unstructured it is possible to place a chart inside the row. This works best when used in conjunction with Dataset Grouping so that each row has a chart with data from that group.
Example
1) Create a Static CSV data source named "Fruit Data" with the following data:
Fruit, Apples,Oranges,MelonsQuantity,15,30,23
2) Place a Table on the report. Set the Data Key property to "Fruit Data", and place the @Apples@, @Melons@, and @Oranges@ keys ineach data source key in a separate column on the table.
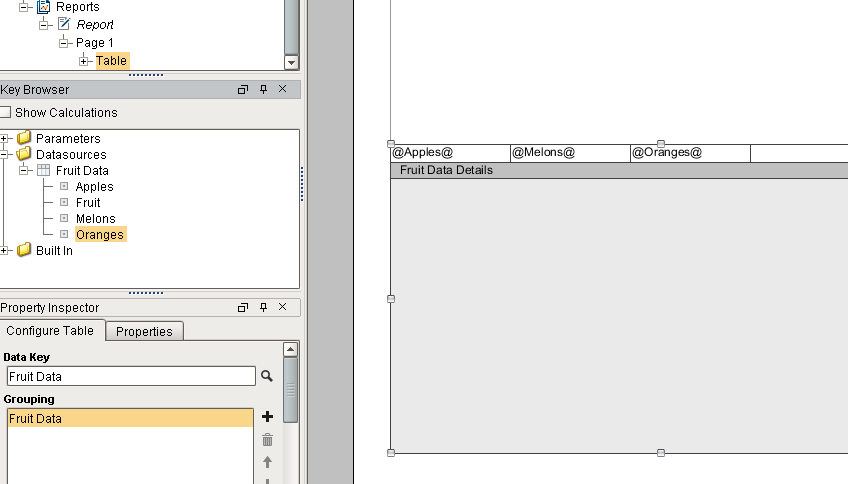
3) Select the Fruit Data Details row and uncheck the Structured Columns property
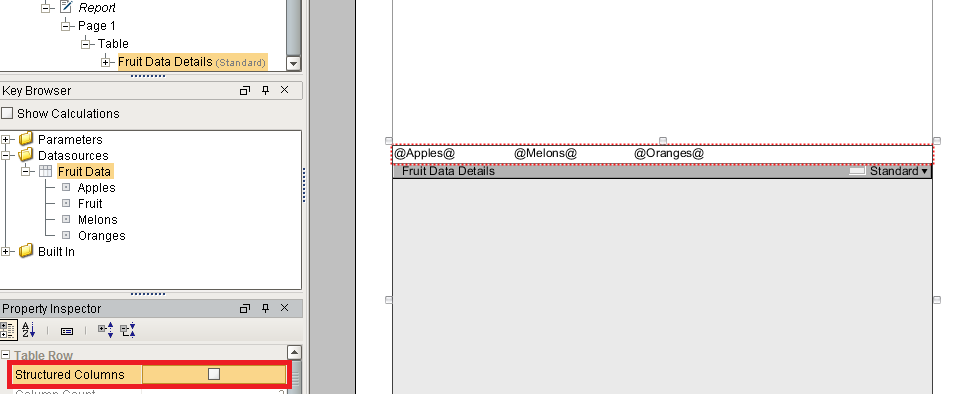
4) Click and drag the Fruit Data Details row to make some room for the chart.
5) With Fruit Data Details still selected, drop a Bar Chart component onto the window. Set the Bar Chart's Data Key property to the "Fruit Data" data source.
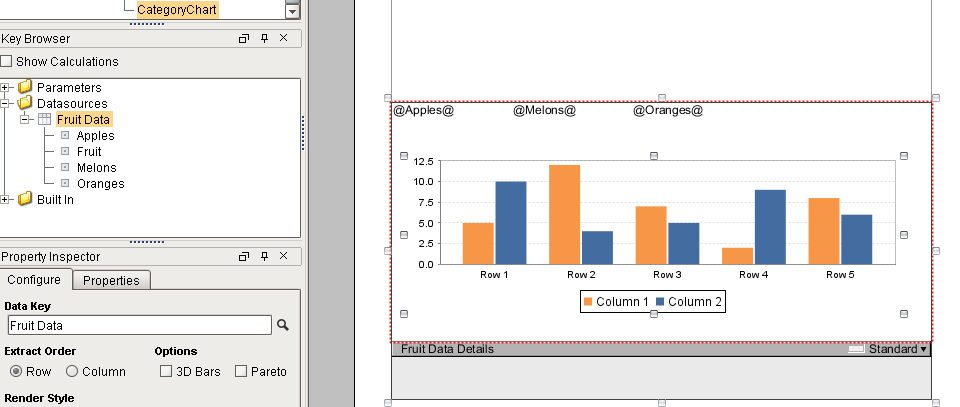
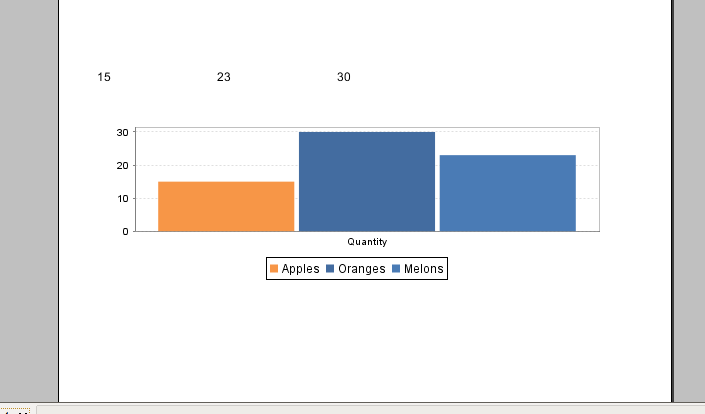
6) Switch to the Preview Panel. You'll see the chart in the same unstructured row.