Easy Chart - Calculated Pens
This section assumes that tags and Tag History have been configured
To learn more, go to the Tag and Set up Tags to Log pages.
The examples below use OPC tags, but Memory, Expression, and Query tags could be used instead.
Calculated pens display a value that is dynamically calculated based on another pen, such as a Moving Average or an SPC Function including a Constant value, Upper Control Limit (UCL), Upper Warning Limit (UWL), Average (Avg), Lower Warning Limit (LWL), Lower Control Limit (LCL), Multiply, Min, and Max.
Using calculated pens on an Easy Cart component allows you to lay a graph on the calculation based off of another pen selected from the Function dropdown list in the Easy Chart Customizer.
To add a calculated pen, right click on the Easy Chart component, and scroll down to Customizers > Easy Chart Customizer.
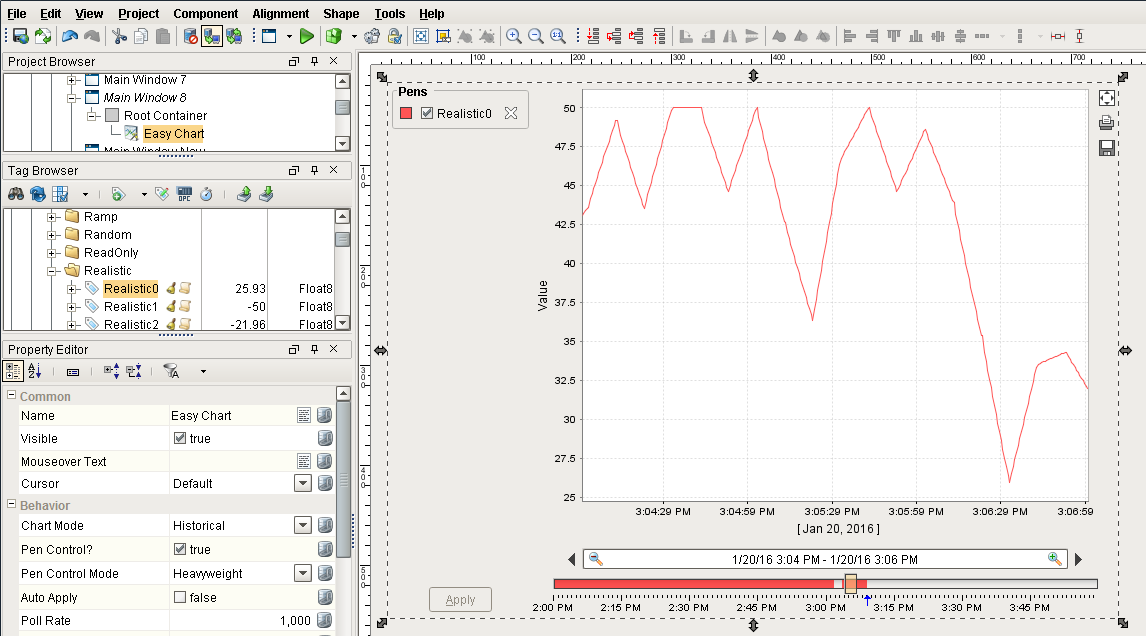
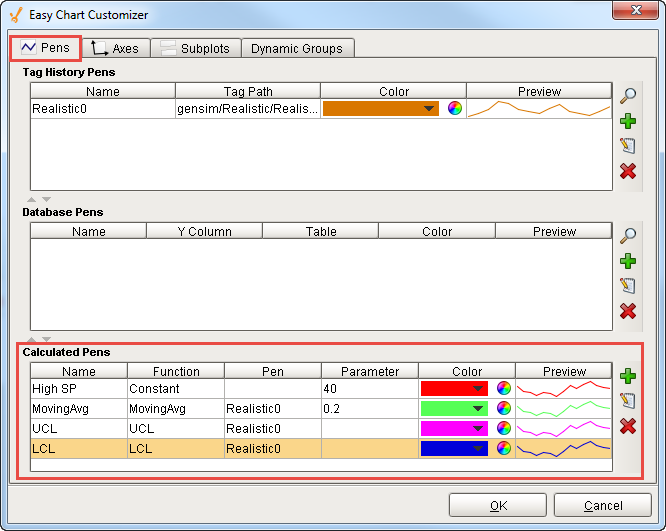
At the bottom of the Pens tab there is a table for all the Calculated Pens. You can add one or more calculated pens by clicking the green plus icon.
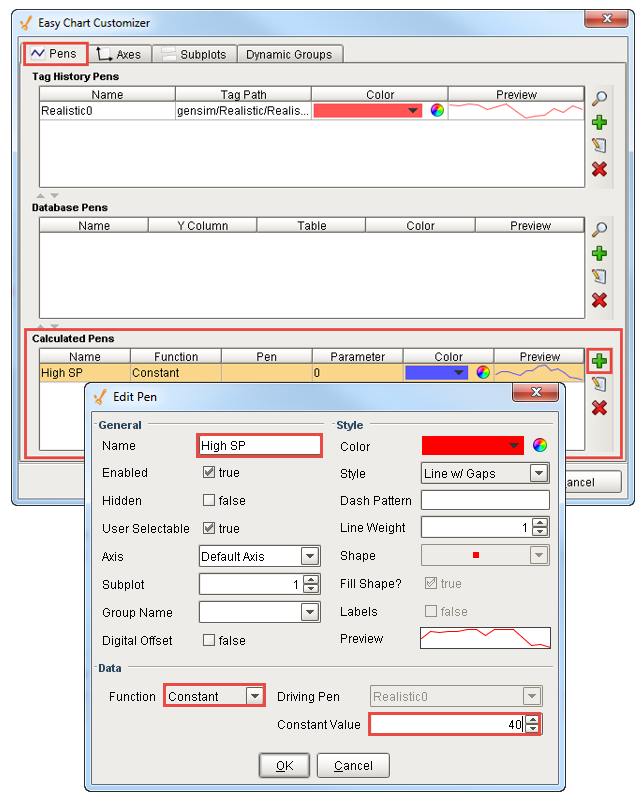
As you add new pens from the the Edit Pen window, you need to give each pen a name. They are just like other pens where you can specify the Style, Color, Axis and Subplot. In the Function dropdown list, you can select which calculation you want to use. The type of functions are: Constant, UCL, UWL, Avg, LWL, LCL, MovingAvg, Multiply, Min and Max.
In this example, add a pen called ‘High SP.’ In the Function field, select ‘Constant’, set the Constant value at ’40’, make the line color ‘red’, and press OK to close the Edit Pen window. Press OK again to close the Easy Chart Customizer.
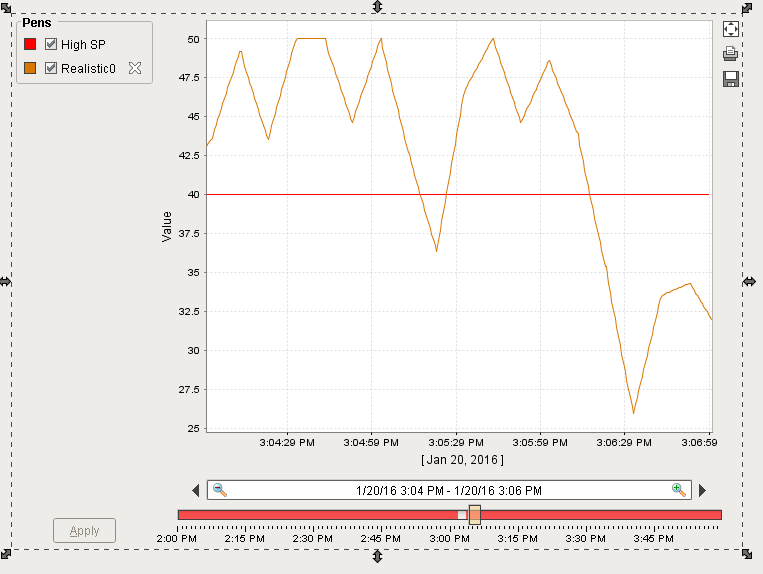
A red horizontal line will be drawn at the value of 40 on the Easy Chart for the High SP value.
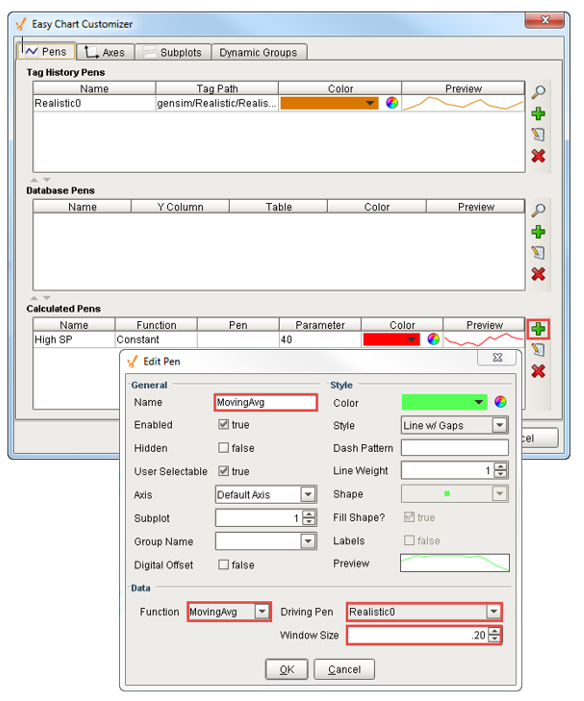
Add a second calculated pen and call this one a ‘MovingAvg.’
On the Edit Pen window, name your pen ‘Moving Average.’ In the Function field, select ‘MovingAvg’ from the dropdown list. Set the Driving Pen to ‘Realistic0.’ Specify the Window Size to the percentage of the total time period that you are going to do a Moving Average on. For this example, set it to 20 percent (0.2) and press OK.
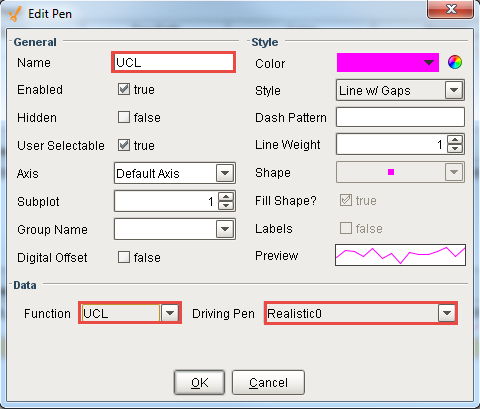
Let’s add 2 more calculated pens. Call the third pen ‘UCL.’ In the Function field, select ‘UCL’ from the dropdown list and set the Driving Pen to ‘Realistic0’. Press OK.
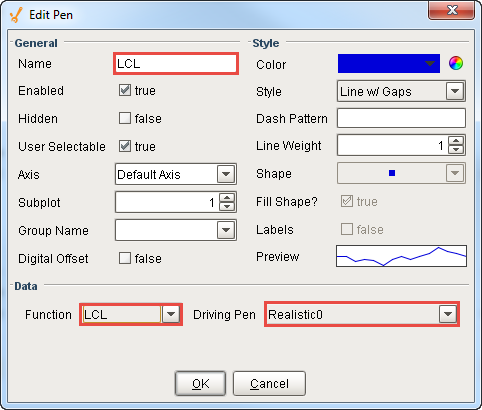
Call the fourth pen ‘LCL.’ In the Function field, select ‘LCL’ and set the Driving Pen to ‘Realistic0.’ Press OK.
Once you added all your pens, you will see all 4 pens listed under the Calculated Pens table: High SP, MovingAvg, UCL and LCL. Press OK.
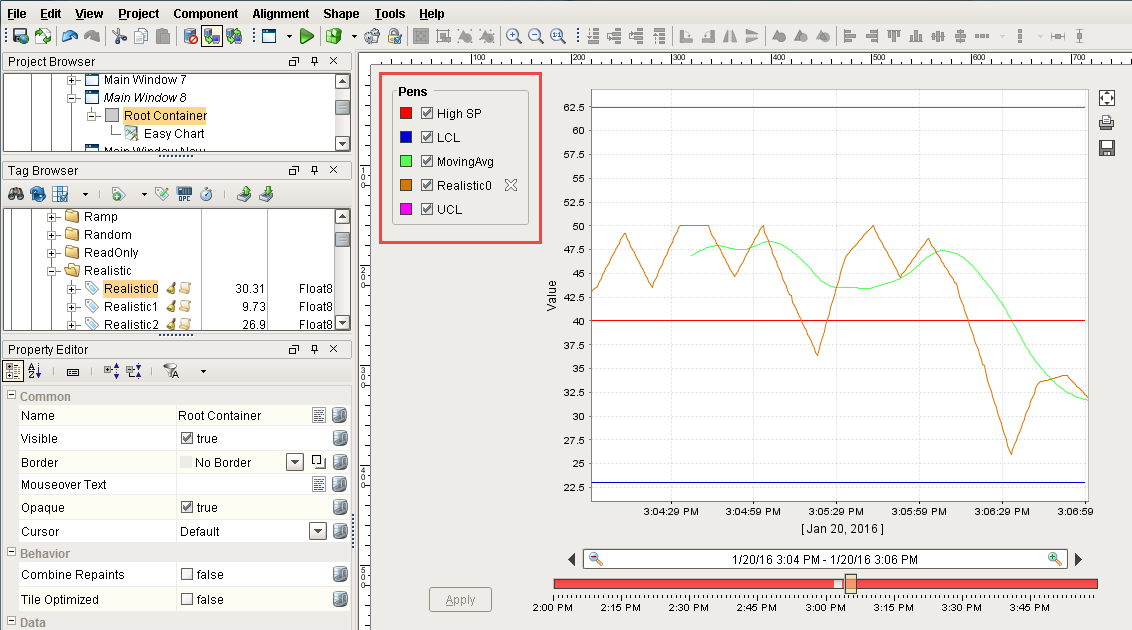
Now you see all your calculations displayed on the Easy Chart. The green pen is your Moving Average of that value. The UCL and LCL are displayed by pink and blue pens respectively, as well as the Constant value displayed with a red line at 40.
Note
You cannot bind the Calculated Pen values inside the Easy Chart Customizer. To bind the function values, use the Cell Update Binding.