Easy Chart - Pen Renderer
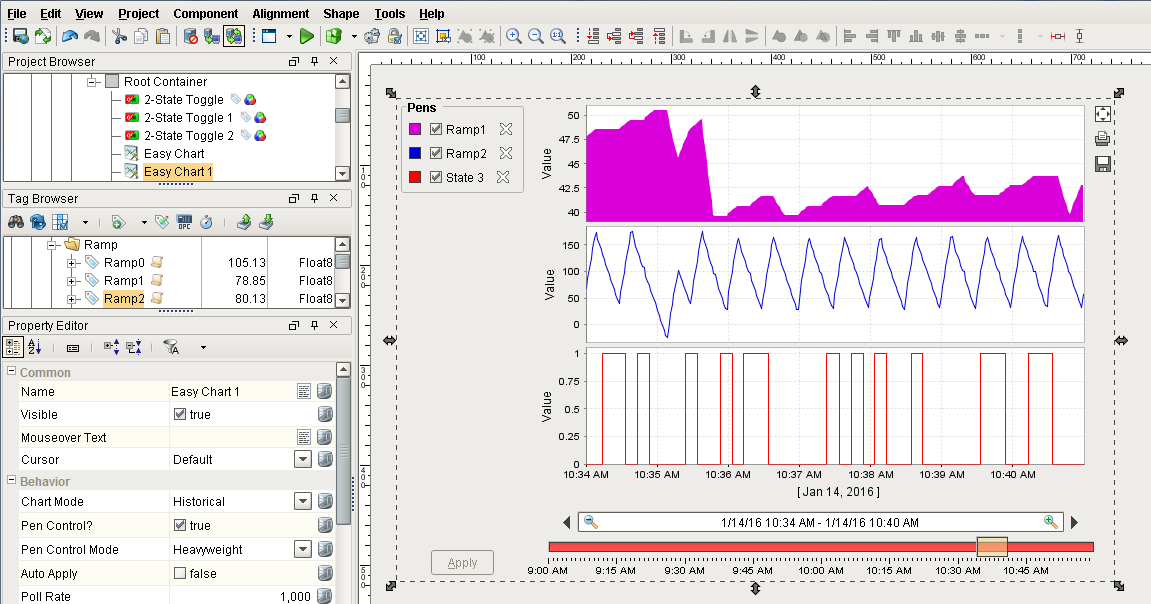
You can customize the renderer of each pen on the Easy Chart to change its style, shape, weight and color. When you add tags to an Easy Chart component, the default renderer or the style of each pen is a simple line as you can see in each of the subplots in the example below.
To customize the pen renderer, right click on the Easy Chart component and scroll down to Customizers > Easy Chart Customizer.
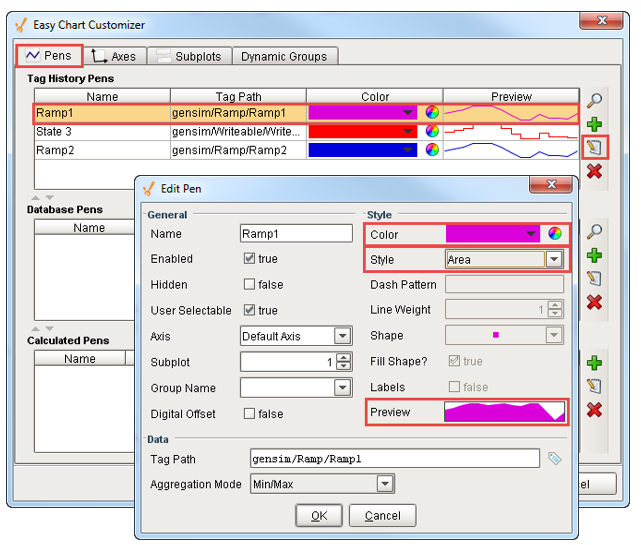
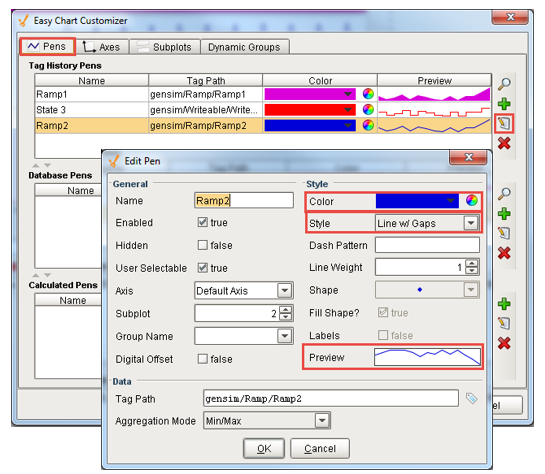
In the Pens tab, go to each of the pens and click the Edit Icon. On the right side of the Edit Pen window under Style, you can change the line color, style, weight, and shape. The Style, by default, is ‘Line with Gaps,’ which means that if you lose communication to the PLC or don’t have data for a particular time period, you will see a gap. You can change the Style from ‘Line w/ Gaps’ to any other style type listed in the dropdown that fits your needs and preferences. In this example, let’s change the pen renderer for the 3 subplots on this Easy Chart.
Select the first pen, click the Edit Icon and change the color to your choice and change the Style to ‘Area.’ You can preview your changes in the Preview field and press OK.
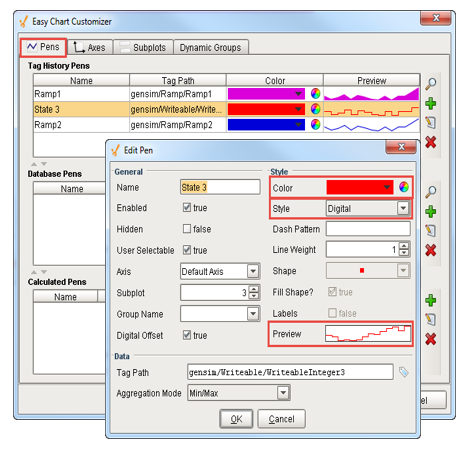
Select the second pen, change the color, and set the Style to ‘Digital’ since it’s a State tag (On or Off / 0 or 1). Preview your changes and press OK.
Select the third pen, change the color and keep the default Style to ‘Line w/ Gaps’. Preview your changes and press OK. Once you set the Style of all 3 pens, click OK.
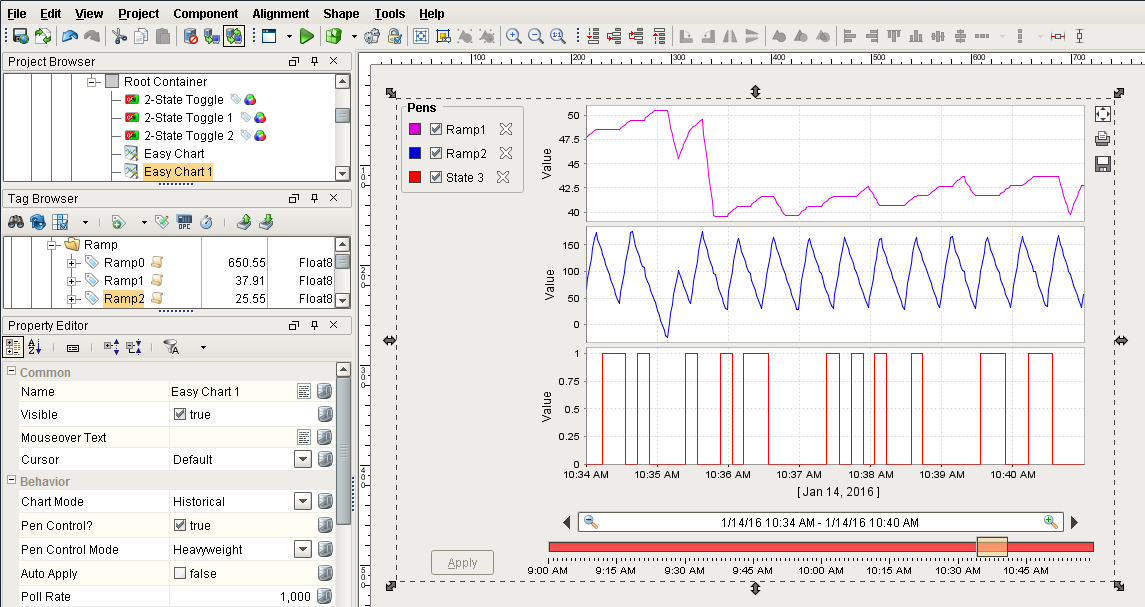
Now, your customized changes to the pen renderer for these 3 pens will be reflected on each subplot on the Easy Chart.