Report Designer
New Design Interface
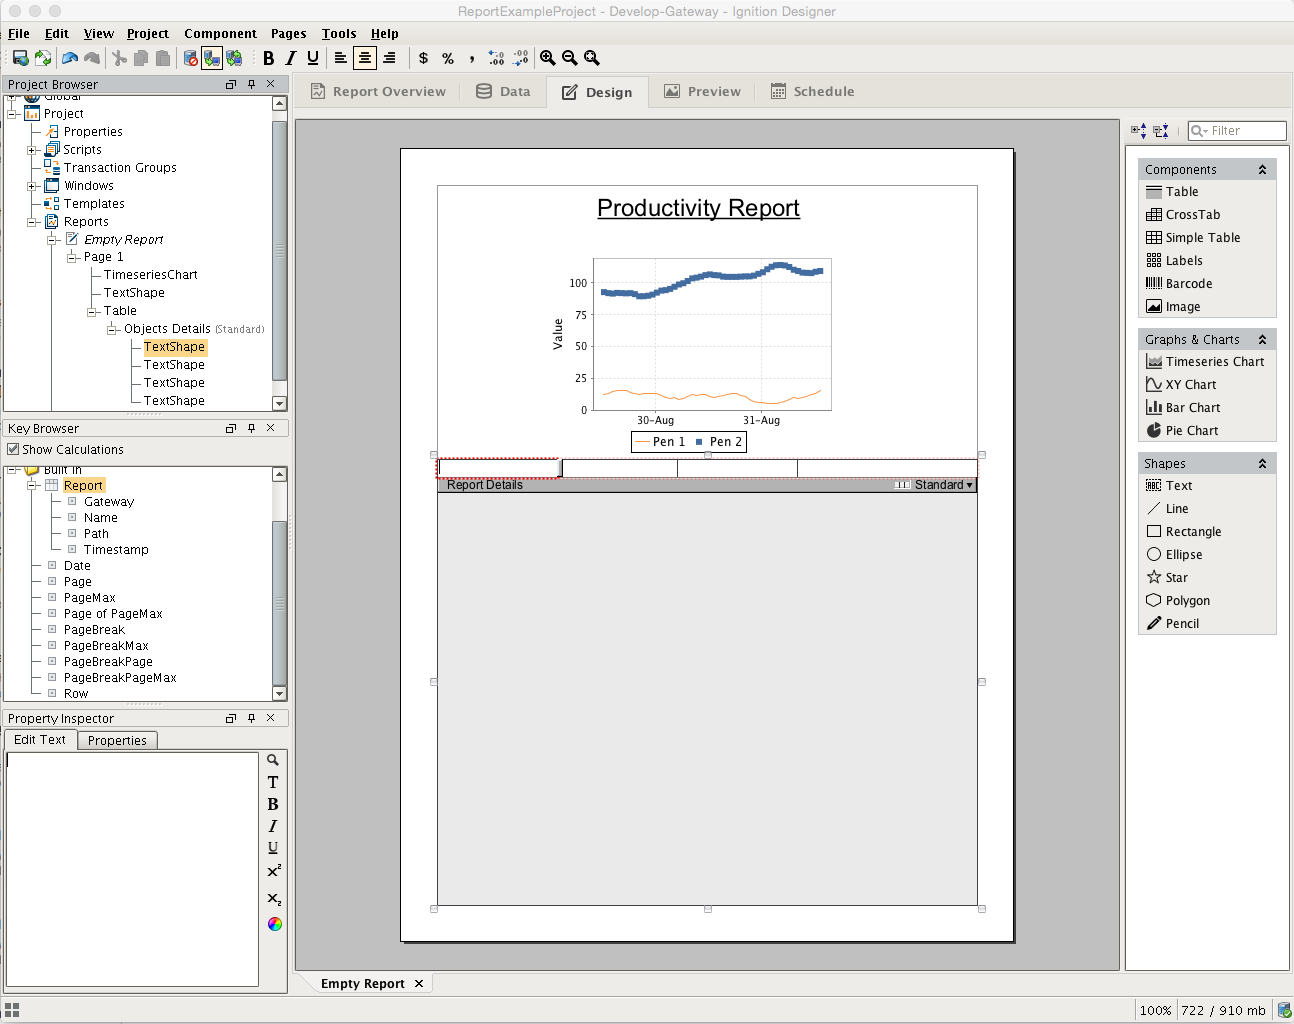
The new Report Workspace's Design tab feels right at home in Ignition and has significant improvements in usability. Strides were taken to maximize the native feel of the workspace's Design tab while not requiring experienced Report module users to abandon their hard-earned knowledge. At the same time, our goal was to simplify the process and remove much the mystery of report design.
Looking at our screenshot of our Report Designer, you'll notice that an open Report Resource in the Project Browser can now be expanded to provide information at a glance. This tree lets you visualize the relationship and hierarchy of Report Design elements on the page. Find an element in the tree by selecting items on the page, or find an element on the page by selecting it from the tree. As you do so, you'll notice that the bottom left of the default Report Designer will change to provide configuration panels and/or property tables depending on the selected item. In between these two panels on the left is the Key Browser which provides the Data Keys and parameters we use to reference data in our report.
The right of the panel is where our design palette lives, providing a number of powerful components, charts, and shapes which we use to build the layout and visualization of our report.
New Design Components in Reporting v3
While some of the components in the Report Designer are unchanged, we refreshed some and created a new configuration interface that is much simpler (and much more familiar) for Ignition users.
Barcodes
New Barcode component added support for 2D barcodes, including QR Codes, PDF 417 and Aztec and Data Matrix.
Charts
Charts were rebuilt from the ground up with simpler configuration, and more options. Plot report data in Timeseries, XY, Pie or Bar Graphs. Configure pens, axis and appearances in a familiar interface!
New Key Browser
Just below the Project Browser is the Key Browser. The Key Browser is home to all your Data Sources, the new Parameters, as well as a number of built-in calculation keys to speed you through the report design process. When you configure a data source and switch to the Design tab, a sample of all your queries is run on the Gateway to get information about the structure of your data. Columns in your data are represented as children in the Key Browser tree.
The Design Panel
Object Layout
Object layout is an important aspect in creating a professional report. Ignition Reporting uses a WYSIWYG (what you see is what you get) approach.
Z Order
Z order defines relative order of objects when they overlap. Simply select the object and click "Bring to front" or "Send to back" in the Component menu
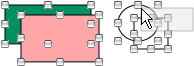
Object Grouping
Grouping makes a set of object behave as one with respect to: selection, moving, and resizing. To "drill down" to individual objects, superselect the grouped object.
Selection and Alignment
Selection is done with the selection tool, which is the default tool in the Report Designer whenever another tool is not activated.
Reporting has a "deeper" selection model than the Ignition designer. Simple object selection is done by single clicking an object. "Selecting deep" is done by double-clicking to get into the report hierarchy. For instance, if you group two rectangles together, you can select the individual rectangles by double clicking "into" the group. With the release of Reporting v3 in Ignition 7.8, visualizing selection is simplified by viewing the Project Browser to see which node in the Report Resource tree is selected.
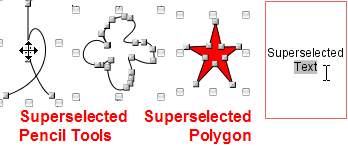
Superselection
Superselection refers to an editing state that some shapes go into when double clicked. Text is the most common of these. When a text box is selected you can move and resize it. When it's super-selected, you can place the text cursor or select a range of characters and insert or delete text. The polygon and pencil are two other basic tools that support superselection.
Multiple Selection
Multiple Selection can be done two ways:
-
Clicking and dragging the mouse over a range of the report. Everything the selection rectangle touches becomes selected.
-
Hold the shift key while making a selection or dragging a selection rectangle. Shapes hit by that action will be added or removed from the currently selected shapes.
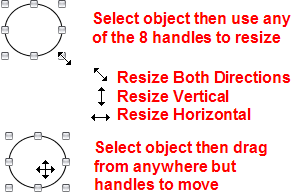
Resizing and Moving objects
To resize or move an object first select it with a single click. To resize left click and drag one of the 8 resizing handles. To move the object, left click and drag anywhere on the object when it is selected. Both operations support shift dragging.
Alignment
Alignment is accomplished by selecting multiple objects, then choosing "Make ..." from the Component menu or right click menu.
|
Menu Items |
Function |
|
Make Row Top/Center/Bottom |
Quickly align several shapes in a row, either by their top, center, or bottom border. Useful when shapes are of different heights. |
|
Make Column Left/Center/Right |
Same as above, but for columns, aligning their sides or center. |
|
Make Same Size, Width, Height |
Make several shapes the same width, height or both. |
|
Equally Space Row/Column |
Equalizes the distance between shapes horizontally or vertically. |
Shift Drag
Holding the shift key while you drag shapes will constrain movement to: horizontal, vertical, or 45 degrees.
Design Toolbar and Menus

The Ignition Designer menu bar provide quick access to many common Reporting Design functions. As can be seen in the screenshot above, the Component and Pages menu items are added to the when the Report Design Panel is open.
Edit
The Edit menu provides functions like cut, copy and paste.
|
Menu Item |
Function |
|
Undo |
Undoes the last action. |
|
Redo |
Re-does the last undo (assuming nothing was changed after the last undo). |
|
Cut/Copy/Paste |
Allows you to easily duplicate or import document elements using the system clipboard. |
|
Select All |
Selects all elements at the current level of selection (or all text, if editing a text field). |
Pages
The pages menu allows you to add or remove pages in the report.
|
Menu Item |
Function |
|
Add Page |
Adds a page to the current open document, after the currently selected page. |
|
Add Page Previous |
Adds a page to the current open document, before the currently selected page. |
|
Remove Page |
Removes the currently selected/visible page in the current open document. |
Component
This shapes menu allows you to modify the layout of objects in a report
|
Menu Item |
Function |
|
Group/Ungroup |
Allows you to merge the currently selected shapes into a single shape for convenient management. Contained shapes are still accessible, via double-click super-select. Ungroup separates grouped shapes. |
|
Bring to Front/Send to Back |
All shapes have an order on the page that determines what is drawn on top when two shapes overlap. These options allow you to alter that order. |
|
Make Row Top/Center/Bottom |
Quickly align several shapes in a row, either by their top, center, or bottom border. Useful when shapes are of different heights. |
|
Make Column Left/Center/Right |
Same as above, but for columns, aligning their sides or center. |
|
Make Same Size, Width, Height |
Make several shapes the same width, height or both. |
|
Equally Space Row/Column |
Equalizes the distance between shapes horizontally or vertically. |
|
Group in Switch/3D Shape |
This feature groups selected shapes in a Switch Shape, which has the same features as Table Row Versions. It's a powerful way to conditionally provide a different look for a specific element. |
|
Combine/Subtract Paths |
Takes multiple overlapping shapes (such as a rectangle and an oval) and combines them into a single shape using the combined paths. A powerful tool to construct complex shapes. |
|
Convert Into Image |
Converts the selected shape into an image. Be sure to group shapes first if you want to convert multiple shapes into a single image. |
Toolbar

The toolbar provides a variety of functions to assist in editing while designing a report.
|
Toolbar Item |
Function |
|
|
Toggles bold of the selected text |
|
|
Toggles Italic the selected text |
|
|
Toggles underline of the selected text |
|
|
Aligns the selected text left |
|
|
Centers selected text |
|
|
Aligns the selected text right |
|
|
Adds a $ to the data key |
|
|
Adds a % to the data key |
|
|
Forces a decimal place on an integer value in a text shape |
|
|
Add the number of allowed decimal digits |
|
|
Subtract the number of allowed decimal digits |
|
|
Increase the size of the report in view |
|
|
Decrease the size of the report in view |
|
|
Have the report fill the available space |


