Chart Properties
Properties on a Chart
Much like properties on a Vision window, Charts have properties that drastically modify their behavior. These properties will appear in the Element Properties panel when clicking on the background of a chart.
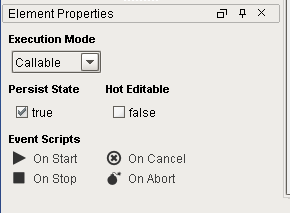
Execution Mode
This property determines how and when the chart should run.
Callable
Callable charts must be called before running. Any number of instances may run simultaneously. There are several ways to invoke a Callable chart:
-
Scripting: system.sfc.startChart will invoke an instance of the Chart.
-
Enclosing Step: Charts using an Enclosing Step may call another Chart.
-
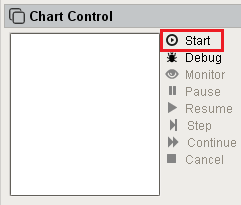
Designer: While viewing the Chart in the Designer, chart instances may be called from the Chart Control panel by clicking the Start link.
RunAlways
The Chart will be initiated by the Gateway upon startup. It can not be executed in any other way. It is probable that this chart will be designed to never end, the idea being that there will always be exactly one instance of this chart running.
Note that if the Chart is aborted, canceled, or flow leads into an End Step, a new instance of the chart will not be called. Because of this, it is recommended to test your charts with the Callable execution mode, and design the Chart with a looping structure in mind.
Disabled
Disables the Chart. This mode is great when a Chart should be "shut off", such as when maintenance is working on a machine. Instances of the Chart can not be called while set to Disabled.
Persist State
If enabled, each running Chart will save its state when the Gateway is shut down. Prior to shutting down, the Gateway will record the state of each persistent Chart to a file in Ignition's installation directory. Once the Gateway comes back online, the Gateway will read this file, and the Chart will resume from where it left off. Values of each chart-scoped variable will be maintained between restarts.
Because the state is recorded on shutdown, all of the following conditions must be true for the state to be preserved:
-
The Gateway has time to record the state before the operating system terminates the process
-
The Chart is between script executions.
In the case of an expected shutdown (the operating system was requested to restart), all running scripts need to stop in a timely manner for the record to be taken, otherwise the operating system may force the Gateway to stop before the record is taken. It is recommended to design your chart in a manner that can easily be paused. This is usually accomplished by breaking up tasks into multiple smaller scripts. More details can be found on the Action Step Best Practices page.
In the event of unexpected shutdown, such as power to the server was cut-out, then the state will not be properly recorded. However, Ignition Redundancy can be used to protect against unexpected shutdowns.
Hot Editable
When enabled, non-structural changes made to the chart will be applied to running instances. This allows development to continue while the chart is running.
A non-structural change is a modification made to a script or expression in the chart, such as adding a new line to a preexisting script. These would be smaller-scale changes that do not involve moving or replacing elements. Moving an element would be considered a structural change, and would not be applied to running charts when Hot Editable was enabled.
Event Scripts
Similar in concept to Event Handlers on Vision components, Event Scripts trigger when certain actions occur in a running chart. The following events are available:
|
Event Name |
Description |
|
On Start |
This will run once when the chart is started |
|
On Stop |
This will run once when the chart is stopped normally. Specifically, when flow leads into an End Step. |
|
On Cancel |
This will run once if the chart is cancelled. |
|
On Abort |
This will run once if the chart is aborted. This occurs when an error in a script causes the whole Chart to fail. If the script on this event fails, a log message will appear in the Gateway console. The exception that caused the abort is available via chart.abortCause Example - chart.abortCause
#Create a logger. Use the path of the chart so each chart will use separate loggers logger = system.util.getLogger(chart.chartPath + " Logger") #Invoke the logger. Use chart.abortCause to report the issue logger.error("Chart Aborted. Reason: %s" % (chart.abortCause)) |
Similar Topics ...