SFCs in Action
Chart Flow
All charts have the same basic flow to them. Some have loops, jumps, or enclosing steps that include whole other charts, but the flow is always the same:
-
All charts start at their begin step. The begin step can define initial values for variables in the chart's scope. These initial values are defined as expressions.
-
Flow always moves downward out of chart elements, except for links, which can move flow in any direction. When a transition splits into 2 or more, they are evaluated left-to-right.
-
When flow hits a step, that step is started. The step continues to execute until the transition beneath it becomes true. If there is no transition beneath a step, the step starts and is told to stop as soon as possible. In practice, this means that an action step's onStart and onStop scripts will be run, but no timer scripts.
-
When any End step is activated, the chart stops.
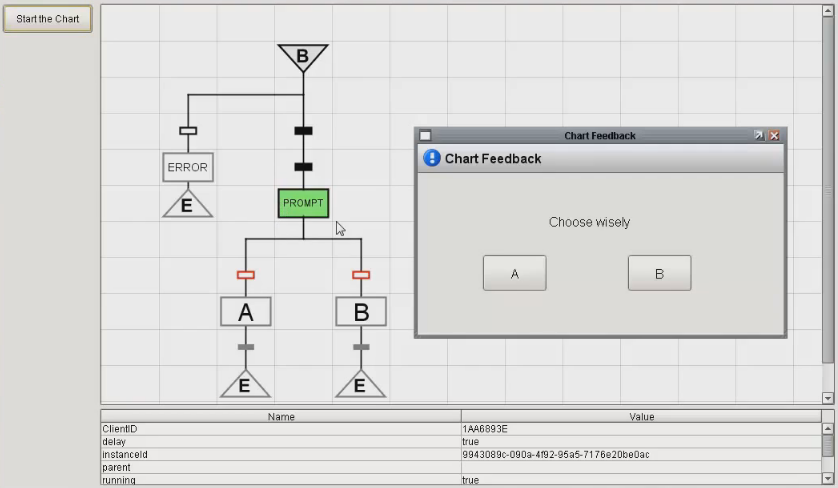
Interaction and Monitoring
While SFCs are run in the gateway, Ignition has tools to help you interact with and monitor charts in the client. There is a chart monitor component that you can use to see the status of your SFCs in the client, there are scripting tools to start, stop, pause, and resume charts from the client, and you can send operator input to a chart with scripting functions.
Examples
Here are some examples of common paths or loops to get you started thinking about your process. You can combine these steps in any way, and create charts large or small.
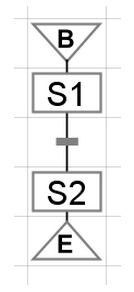
Basic Transition
In this example, step S1 executes as soon as the chart starts, and continues executing until the transition beneath it becomes true. Once that transition becomes true, Step S1 is told to stop, which means it finishs executing any scripts that are currently running, and then it executes its onStop action (if any).
After S1 has stopped, step S2 starts. It is immediately told to stop, which means that if it has any timer actions, they will not run, but the start and stop actions will run.
After S2 is finished, the chart stops.
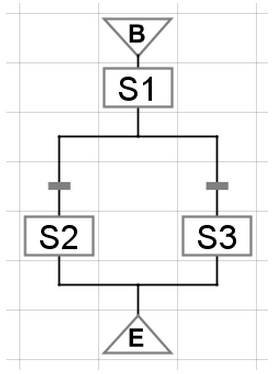
Branching Transition
In this example, step S1 executes as above, except that it has two transitions beneath it. This is how you do conditional logic in a chart. S1 runs until either of these transitions becomes true. When one transition becomes true, flow will follow that branch of of the chart. If both transitions are true, the transition on the left is chosen. Position is meaningful for charts - transition precedence goes from left to right.
Only one of S2 or S3 will run, but never both.
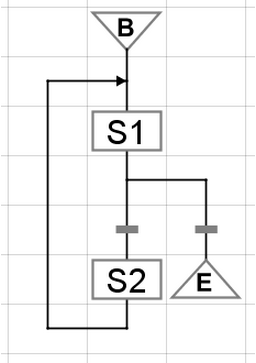
Loop
In this example, S1 executes as above, looping until one of the transitions becomes true. If the branch to S2 becomes active, S2 runs once and then S1 starts looping again immediately. This way the chart can execute multiple times.
This is how you configure repeating logic in a chart. The two transitions determine whether this chart continues running (possibly indefinitely) or stops.
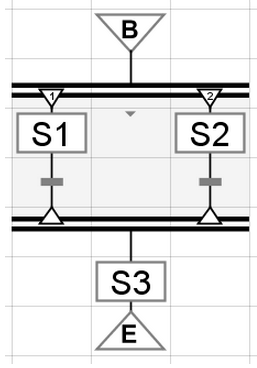
Parallel Execution
In this example, steps S1 and S2 execute simultaneously. They both continue to run until the transitions beneath them become true.
Flow only moves past the parallel sync (the bottom of the parallel section) once both transitions become true. Step S3 then runs, and then the chart stops.
In This Section ...