Report Pie Chart
The  adds a Pie Chart based on a simple two column data structure.
Usage
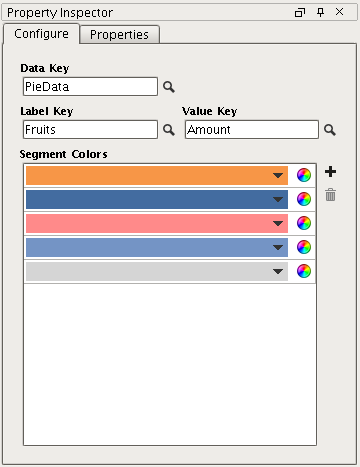
To create a new Pie Chart, drag the pie chart palette item from the Report Design Palette onto your Report Page or Parent Shape. A pie chart has a simple configuration consisting of label values (generally Strings) and numeric quantity values. Color segments can be added or removed by clicking the  button on the Configuration panel.
Example
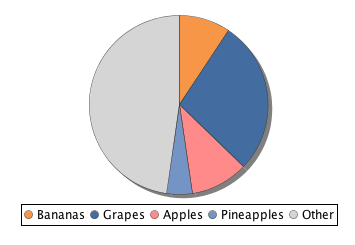
The Pie chart in the images above was created using a simple data source which had just two columns, the first which represented our Label, the second being a column of values.
Fruits, Amount"Bananas", 52"Grapes", 154"Apples", 58"Pineapples", 25"Other", 265
While this example may seem simple, any data source containing values can be used in similar way by simply using two relevant data keys from a more complex source.