Binding a Dataset Property to Realtime Values
The Cell Update binding enables you to easily make one or more cells inside a dataset dynamic. This is particularly useful for components such as the table, to easily display realtime Tag information, or in the linear scale which stores configuration information in a dataset. The cell update binding will only appear as a binding option when setting up a binding on a dataset property. Otherwise, it won't be present.
Cell Update Bindings also work really well with the Easy Chart component, allowing you to indirectly show tag history on the same easy chart. See Indirect Easy Chart for more details.
Realtime Tag Values in a Table
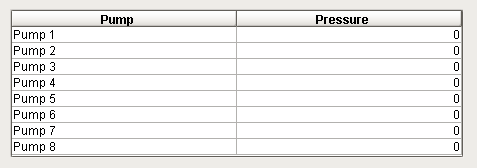
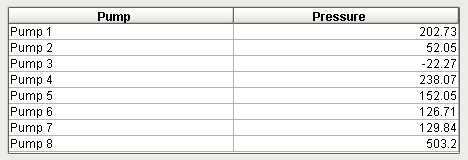
The cell update binding allows you to place the value of a Tag into a dataset easily. With a dataset property like the one on the table component, getting updating values into it required either a SQL query, or some constantly running script. With the cell update binding, that isn't necessary. Take my simple static table. I entered in eight rows for the eight pumps I have, each having a list of pressures. I could use a bunch of numeric text fields and labels, but I think the table component looks much nicer compared to all of those labels and numeric text fields.
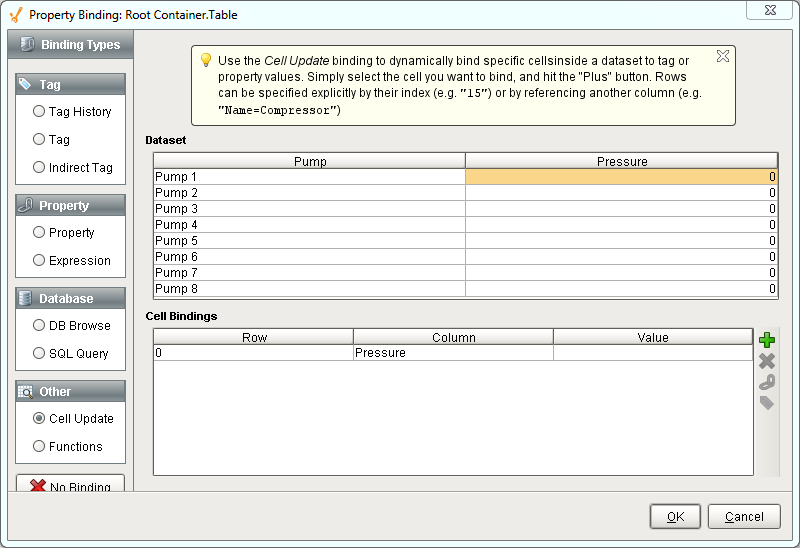
I have eight Tags with pressure readings from each pump, now I just need to use cell update binding to get them into the table. Opening up the cell update binding on the data property of the table, I see my dataset, along with space below for cell bindings. I select my first row pressure reading, and hit the add (  ) button next to the cell bindings page. It has added a row to the cell bindings page with its row number, the column name, and a blank value cell. What I place in that blank value cell will determine what the value will be in the table.
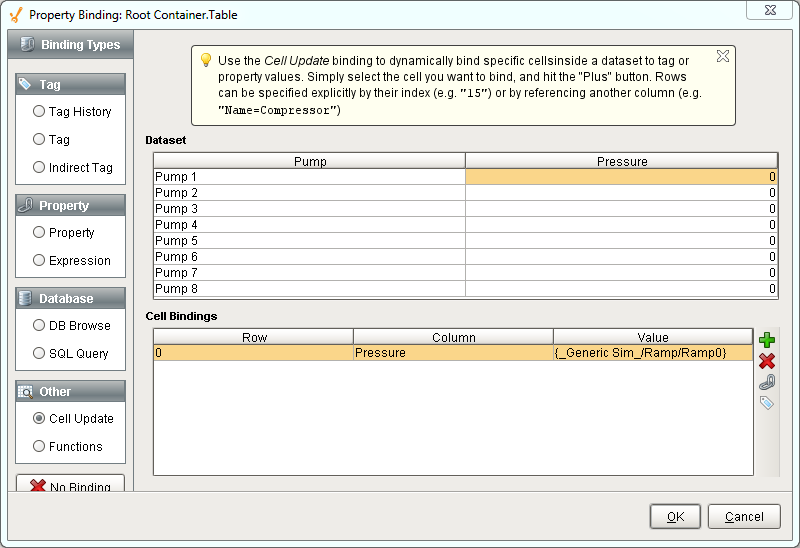
I select that first row of the cell update binding and use the tag (  ) button to the right to select my tag reference. You can also manually type in your tag reference, or place in a property reference instead.
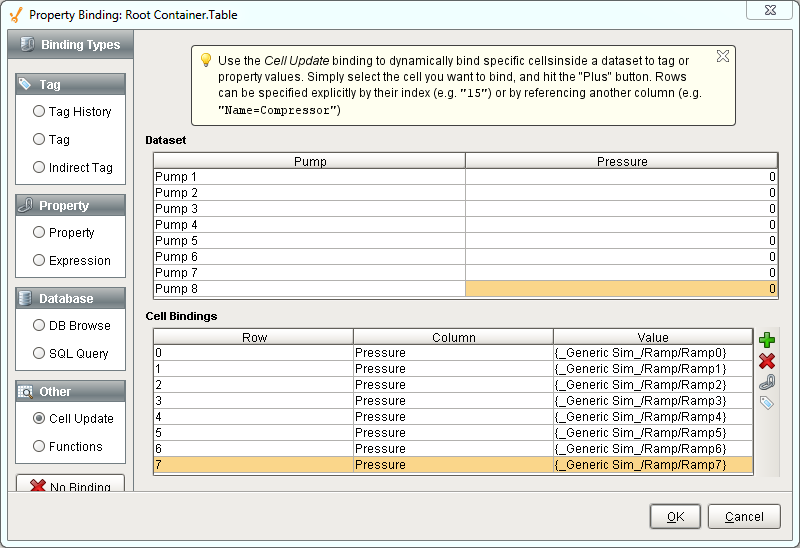
I have now bound the value of that Tag to the Pressure column in row 0. I then do this for the other 7 Pumps so that my cell update binding window looks like this:
After confirming the binding, we can see that our table values are now updating with the value of the tag.
Adding a Realtime Indicator to the Linear Scale
The Linear Scale is a component that has a special customizer to allow you to configure setpoints on it. You can setup the value, color and style of them, among other properties. During runtime, these values are normally static, as there is no way to setup a binding in the customizer. However, the customizer merely configures a dataset that the component uses to create the indicators. If you take a look at the Indicators dataset property of the Linear Scale, it has all of the properties that are configurable in the customizer. Changing them from the customizer will alter the dataset, and changing the dataset values will alter what you see in the customizer. Knowing this, we can setup a cell update binding to manipulate the values during runtime.
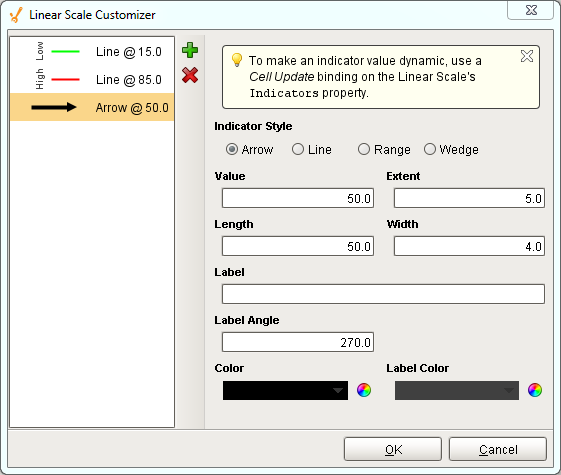
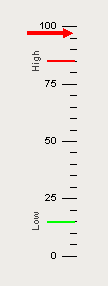
I have taken the linear scale component and added another indicator to it. This one I have made into a large arrow, as this is going to be my indicator as to what the current value is.
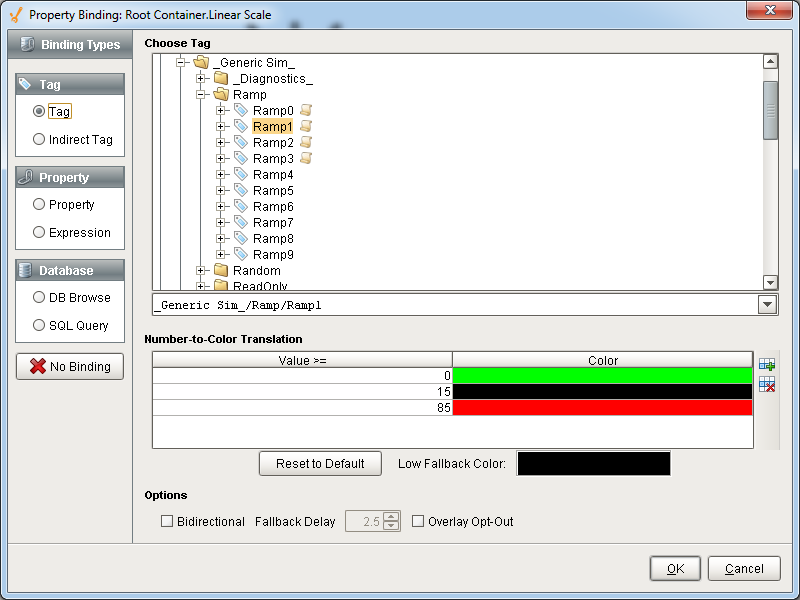
In addition to changing the value of the realtime indicator, I would also like it to change its color based on its value. If it is above the high indicator it should change to red, and below the green it should change to green. To accomplish this, I setup a custom property on the Linear Scale of type Color, and setup a number to color Tag binding on it. Those values I have there are based on the static setpoints I have set.
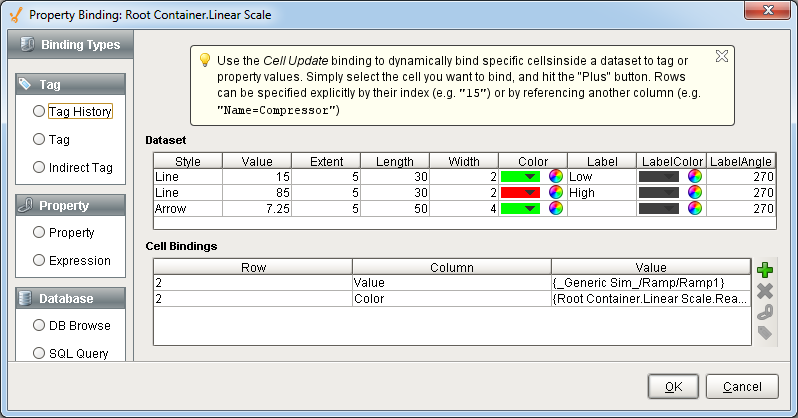
Finally, I setup a cell update binding on the Indicators dataset property of the Linear scale. Notice how both of my cell bindings are for the same row, just different columns. This is fine, as long as there aren't duplicate bindings for the same cell. I am binding the value to the same Tag used in our custom property color binding to get the value, and the color cell to the color custom property. Notice that you can use both Tags and property bindings in a cell update binding.
Now our Linear Scale has an indicator that moves to show a realtime value, and changes color whenever it goes outside our setpoints.
Similar Topics ...