Alarm Status - Tag History and Alarm History
The Alarm Status Table component has a unique feature built into it that lets you view the actual trend of a tag's value and an alarm's history for any alarm that is currently active. It shows you exactly where the alarms occurred, when it was cleared, and when it was acknowledged.
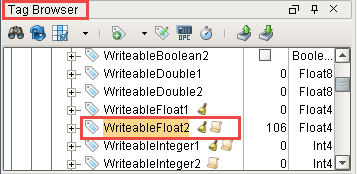
For the trend feature to work, you must have your tag history setup so it’s logging to the Tag Historian as well as an Alarm Journal Profile configured so that the log history gets logged to a database. As long as both the Tag Historian and Alarm Journal are configured, you will see the trend for any given alarm that is currently active or in the Alarm Status Table list.
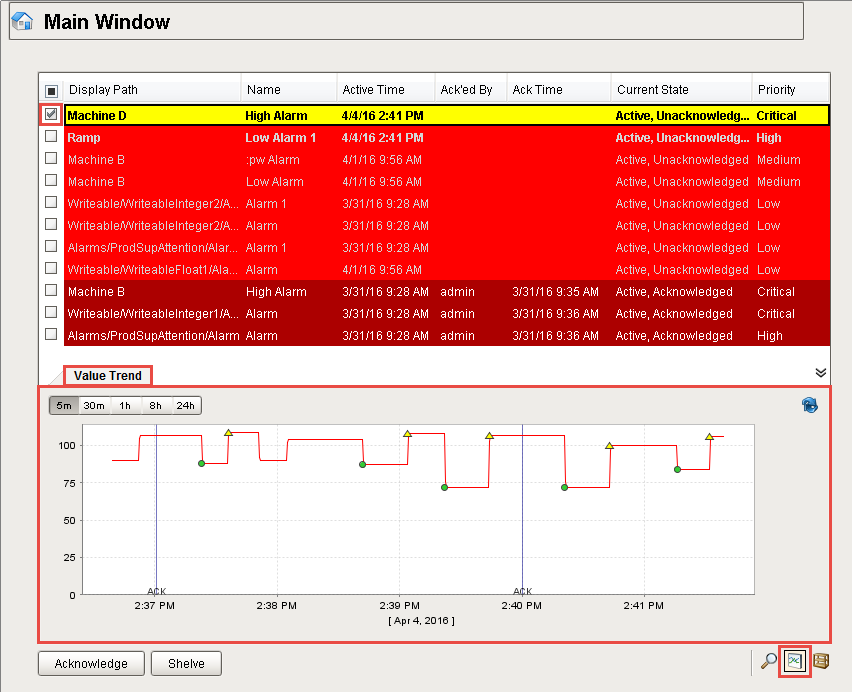
In the Alarm Status Table, select any alarm and click on the Trend icon ![]() located on the bottom right of the table. The trend chart shows you the trend of the selected alarm's value over time. You can look at the last 5 minutes, 30 minutes, 1 hour, 8 hours or up to 24 hours to view the exact history of that tag's value, as well as all the alarms that occurred over time. The yellow triangles denote when the alarm was active, the green circles identify when the alarm was cleared, and a vertical black bar shows when the alarm was acknowledged. It’s all built into the Alarm Status Table component and you don’t have to go to a separate window to view an alarm trend or alarm history.
located on the bottom right of the table. The trend chart shows you the trend of the selected alarm's value over time. You can look at the last 5 minutes, 30 minutes, 1 hour, 8 hours or up to 24 hours to view the exact history of that tag's value, as well as all the alarms that occurred over time. The yellow triangles denote when the alarm was active, the green circles identify when the alarm was cleared, and a vertical black bar shows when the alarm was acknowledged. It’s all built into the Alarm Status Table component and you don’t have to go to a separate window to view an alarm trend or alarm history.
Similar Topics ...