Sequential Function Charts
What Are Sequential Function Charts?
A Sequential Function Chart (SFC) is a series of scripts that are defined in a single location, and then called in sequential order. Additional elements in the chart can determine where the flow of the chart will lead. Charts can loop around indefinitely, or execute a set number of times before ending. Sequential Function Charts are based on a graphical programming language in the IEC 61131-1 standard. This language may be familiar to PLC programmers, as it is one of the languages commonly available for programming PLCs.
SFCs are used to execute logic in ways that are more convenient to structure than with Python scripts or PLC programming alone. Because of their inherently visual depiction, they help to illuminate logic to users, and facilitate intuitive development and refinement. Charts can be monitored as they run visually, making troubleshooting easier than with scripting alone.
When Should I Use a Sequential Function Chart?
SFCs can be used for many tasks, but they shine in the following conditions:
-
Situations where multiple processes need to run in parallel. The nature of a chart allows for controlled execution. Pauses are handled by the chart, so there is no need to put threads to sleep.
-
When multiple processes must be completed in a specific order. Charts always execute steps sequentially. A step will never become active out of order.
-
Complicated multi-step processes. The nature of SFCs allows the user to visually build the work-flow of the chart, so troubleshooting is a breeze.
-
Linked processes. In cases where several processes should only be called together. Scripts in a chart can only be invoked by the chart, so external scripts or resources will not be able to directly call the code from any of the steps.
How Do Sequential Function Charts Work?
SFCs are built in the Designer, and executed on the Gateway, so they run independently of any Clients. They make use of both Python and Ignition's Expression language, so any number of tasks are possible from a single chart. A single SFC in Ignition can be called multiple times. Parameters can also be passed into a chart as it starts, so multiple instances can work on separate tasks individually.
Simple Visual interface
Charts elements are drag-and-drop, and work similarly to the components you are used to using in the rest of Ignition.
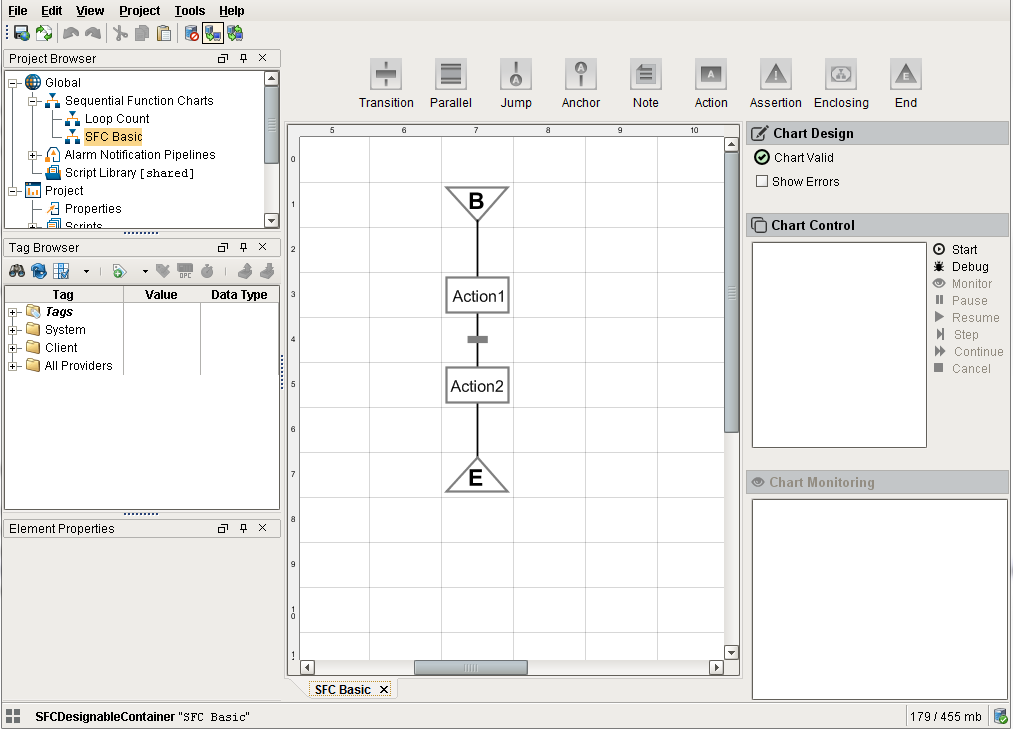
Chart Elements
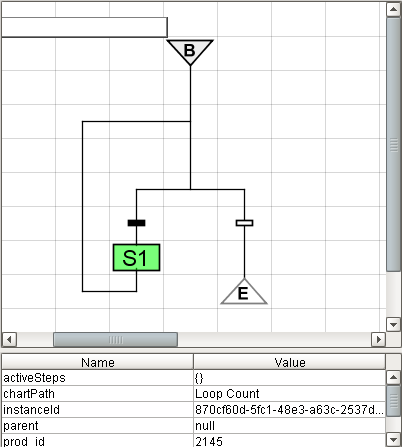
Charts are comprised of elements, and these element perform the work in a SFC. Each element does something different, but they generally serve to either control the flow of the chart, or execute one or more Python scripts.
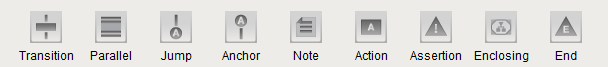
Chart Flow
Charts always flow in the same way. They start at their begin step, and the logic of the chart typically flows from the top to the bottom, however charts are able to loop back to previous steps. Doing so allows for looping logic to be built directly into the chart. Flow of the chart can be halted by a Transition element. The state of the Transition can update in realtime, so a chart can pause until a user approves the chart to move on.
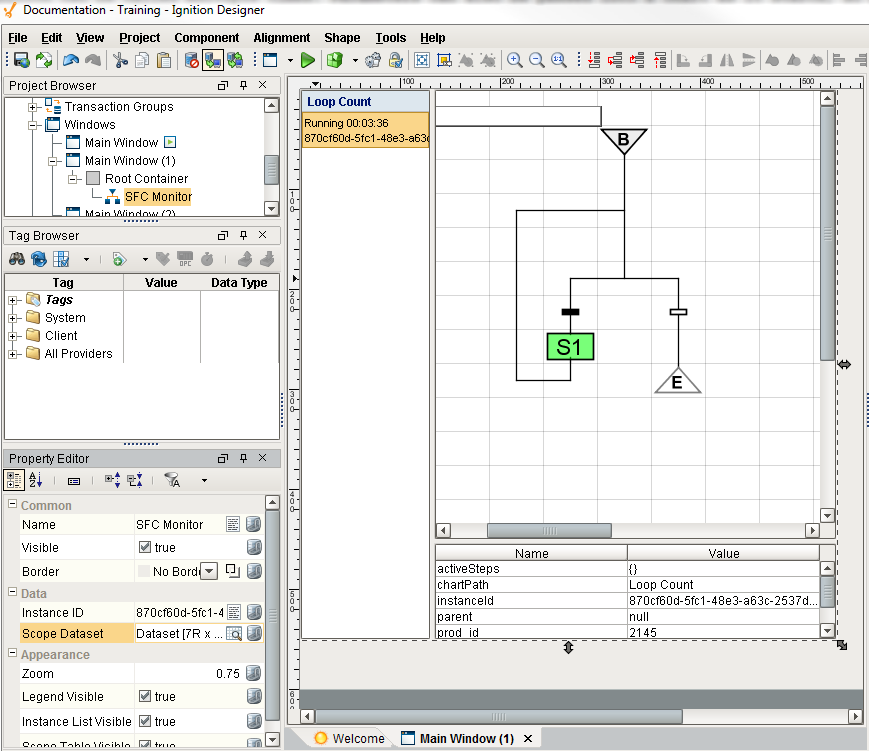
Monitor Chart Activity
Simple HMI interfaces can be developed to manage the SFC. An SFC can be started with a simple button or it can be managed with the SFC Monitor component.
Sequential Function Chart Architecture Examples
Simple Chart
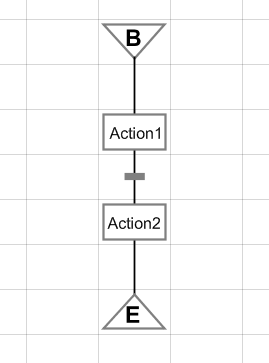
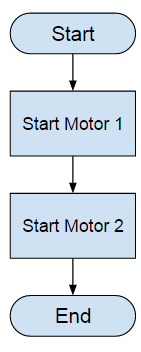
Performing multiple actions with a single call is easy to do with SFCs. Let us assume several motors all need to start from a single call. The work-flow would look like the following:
Process Overview
-
The chart would Start and then move to the first motor.
-
The Start Motor 1 action would then run a script to start Motor 1.
-
Once the script finishes, the chart then flows to Start Motor 2, and calls a script that would start Motor 2.
-
When the second script finishes, the chart flows to the End step, and concludes the chart.
Incorporate a Handshake
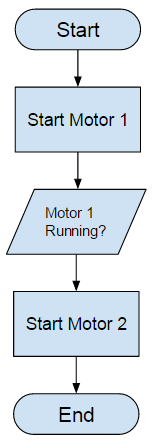
In many cases, a chart will need to wait for some other system to finish with a task before moving on. This is similar to receiving a handshake from the PLC before moving on. Charts can freely read and interact with the rest of Ignition, so a step in a chart can read a tag, run a query, make a web services call, read a local file, or do anything that is possible from a Python script. A chart could wait for a specific value on a tag, and then proceed after the value has met some set-point.
-
Start the chart
-
Run the script on Start Motor 1
-
Wait until the PLC sets the value of a specific tag to a "Running" status code. All other scripts are on-hold while waiting.
-
Run the script on Start Motor 2
-
End the chart
Parallel Processes and Flow Control
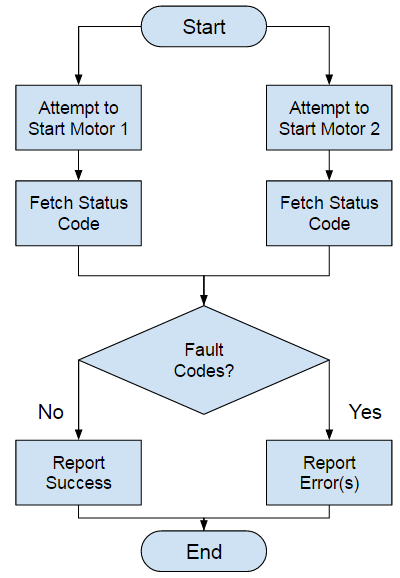
SFCs work great when multiple processes must run simultaneously. Transitioning from one step to another only occurs when the active step finish executing. This means multiple steps can execute in parallel, and later steps will not begin until all of the currently active steps have finished. This type of control is normally very difficult to accomplish with just Timer or Tag Change scripts because each script needs to be able to notify the other script once complete. SFCs allow the chart to monitor each step, and determine when it is time to move forward.
Charts can also make use of local parameters. After reading values from outside the chart, these values can be stored in a parameter on the chart. The value of these parameters can then be referenced by other elements, and the chart can decide where the flow should move towards.
-
Start the chart.
-
Attempt to start both Motor 1 and Motor 2.
-
Check the Status Code from both motors. Pause all additional activity until a reponse code is retrieved from each motor.
-
If Fault Codes were returned, then Report the Errors, otherwise Report the Success.
-
End the chart.
In This Section ...