Alarm Journal - General Filtering
Alarm Journal Profile
To view alarm history, an Alarm Journal Profile must be created first before logging alarms to the database.
Alarm Journal Table Filtering
Ignition provides a host of filters to view alarm history data. Not only can you filter the Alarm Journal Table on a date range to see alarm history data within a specific time period, but there are also a number of other filters you can use as well.
In the Alarm Journal Table component you can filter on alarms in two different areas in the table; filter properties in the Property Editor and the filter icons located at the bottom of the Alarm Journal Table component.
Setting up General Filtering on the Alarm Journal Table
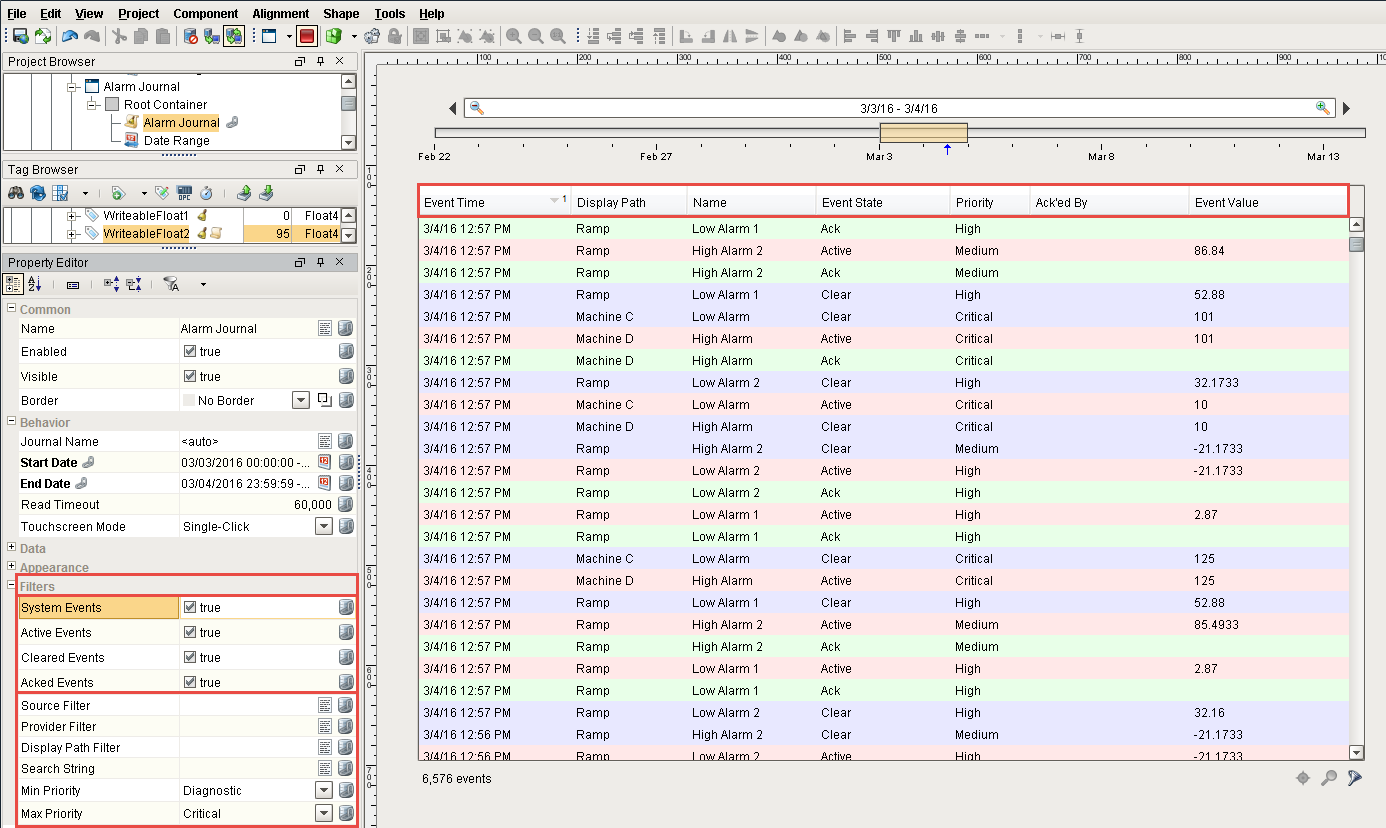
In the Designer, drag an Alarm Journal Table component into your window. By default, Ignition filters on four different type of alarm events: System Events, Active Events, Cleared Events and Acked Events. In the Property Editor you can see each type of alarm event.
For example, if you uncheck the Cleared Events and Acked Events, the Alarm Journal Table will show only Active and the System events. If you want to show only Active events, check Active Events and leave the other events unchecked. It's easy to configure the event filters on the type of alarms you want to see.
You can also filter on Source Path, Priority, Display Path and even create your own Search String. This example shows a basic filter displaying all the alarm events. Each color represents a different alarm state. In Preview Mode, you can right click in the column header to show or hide columns, reorganize the columns, and resize the columns.
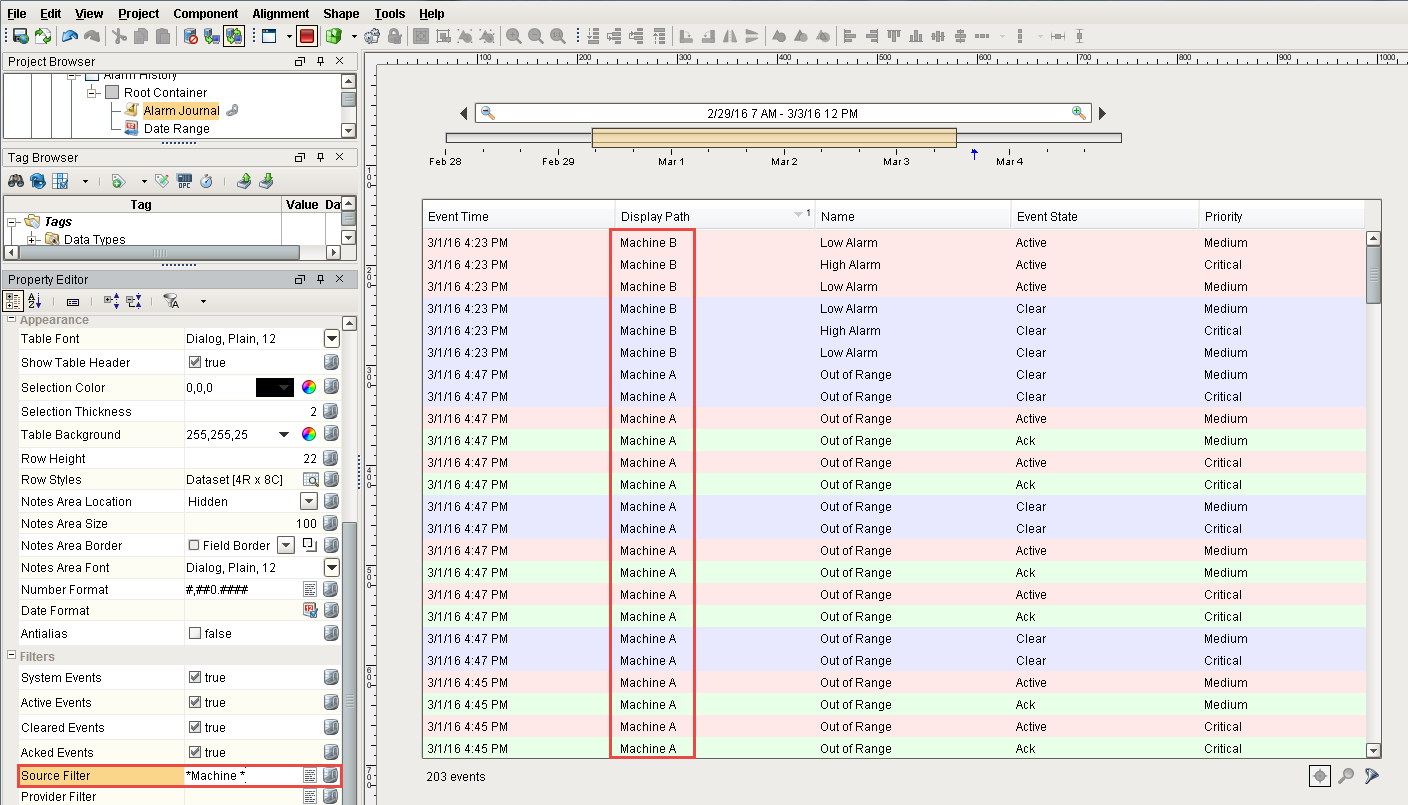
There is also a way to filter alarms based on a Tag Path, Tag Provider and alarm Name. If you configure alarms in particular folders in Ignition, you can use the Source Filter to find alarms by Tag Path. In this example, *Machine* was entered using wildcards in the Source Path field of the Property Editor to find all the 'Machine' alarms in all the Machine folders.
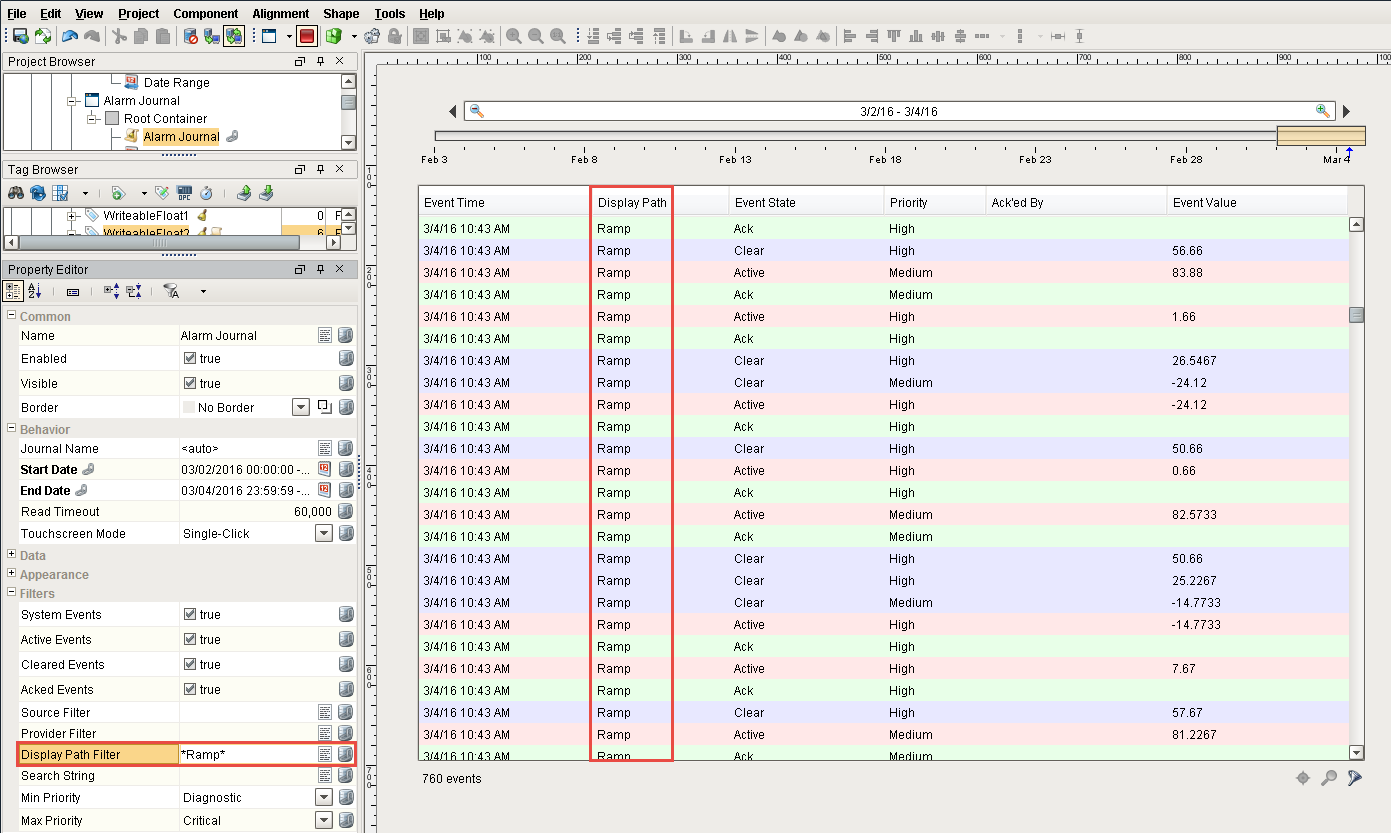
You can also filter on alarms by name using the Display Path Filter which was setup in the alarm configuration. In this example, *Ramp* was entered in the Display Path field to find all the alarms in the system with a 'Ramp' name.
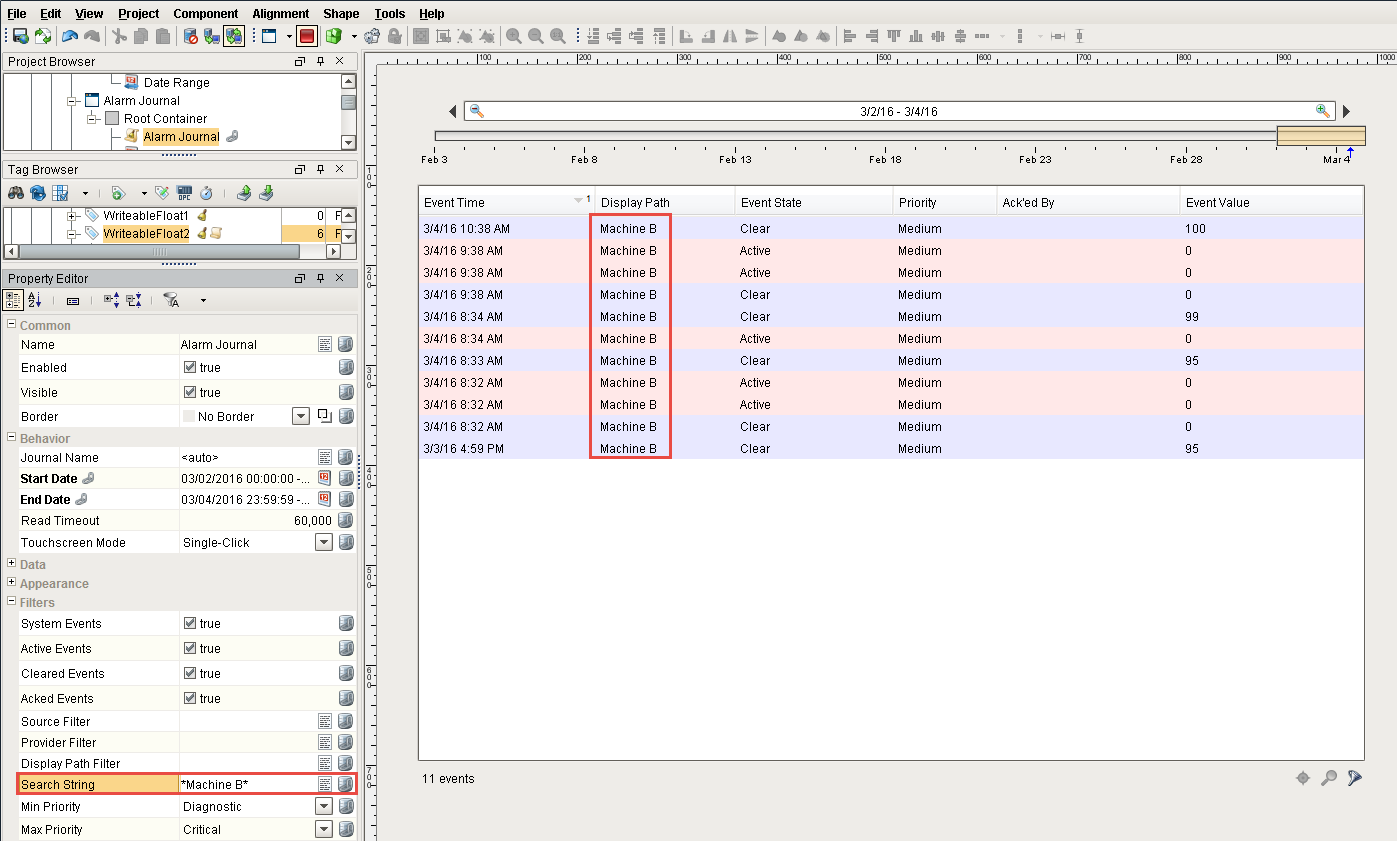
You can also create your own Search String to find specific alarms, events and conditions. In this example, *Machine B* was entered in the Search String field to find all Machine B alarms in the system.
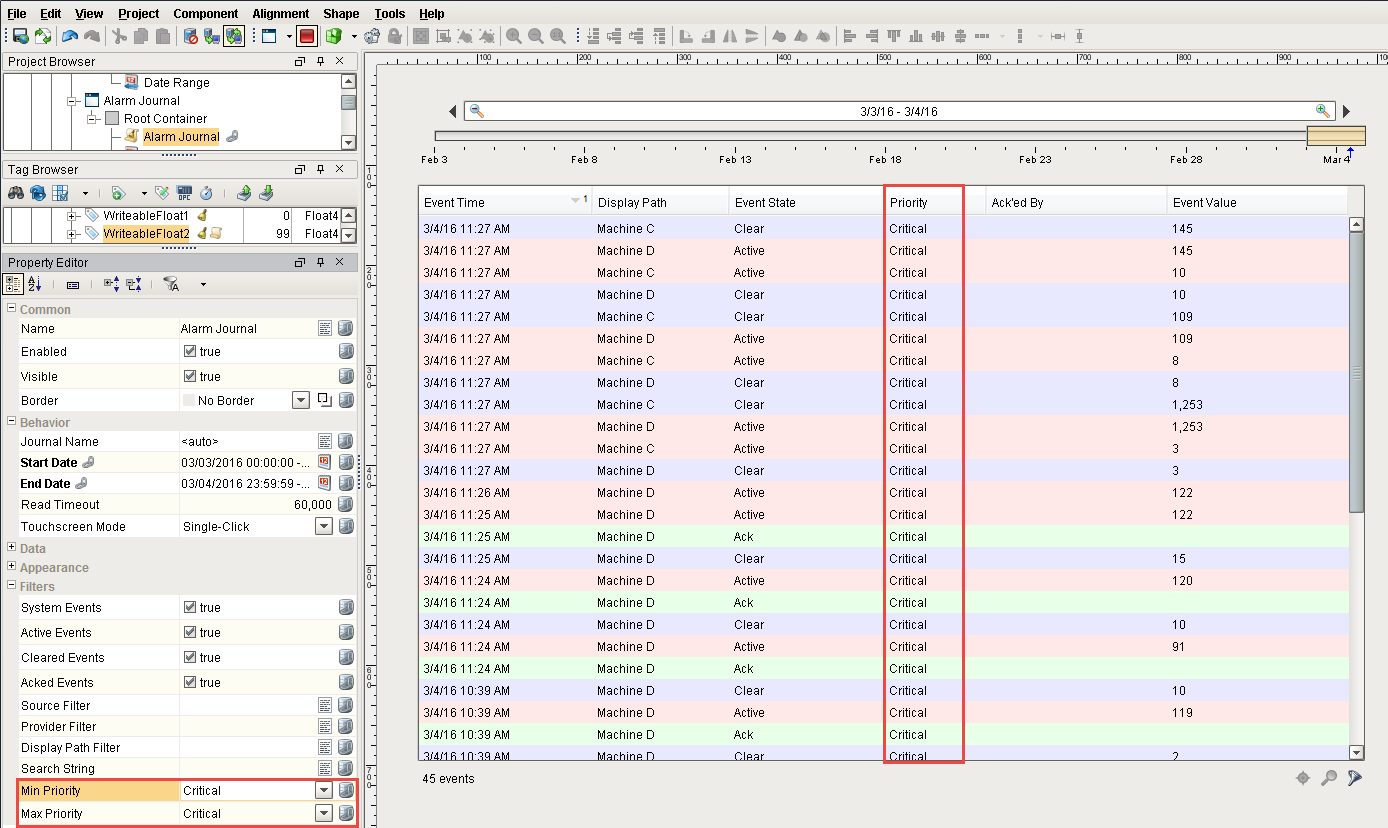
Lastly, you can filter alarms based on Priority. Typically, when you open the Alarm Journal Table, it displays every single alarm on all the priorities from Diagnostic to Critical. If all you want to do is display Critical alarms, select ‘Critical’ from the Min Priority field and ‘Critical’ from the Max Priority field. Now, only the Critical alarms will be displayed in your table.
All of the Alarm Journal Filter properties are bindable so you can design your windows and let the operator choose and filter the alarm data based on how they want to display it.
Similar Topics ...