Reporting Interface
Reporting v3 brought some significant changes to the way Reports are structured. No longer is the Reporting Module simply a Vision add-on. Of course, you retain the ability to add reports to Vision Windows, but it's also possible to create complete reports without having dependencies on other modules because Reports are now Project-Level Resources. Once you install the module, you'll be able to open the Ignition Designer and immediately see a new root resource folder. To create a new report, right-click on the root Report node in the Project Browser and a new Report Resource will be created.
Reports as Project Resources means that you are no longer reliant on Ignition Clients to generate reports. Reports now run on the Ignition Gateway, allowing completely headless generation and distribution. As detailed in the Scheduled Reports section, your reports can now run automatically!
New Resource Means New Workspace
When we set out to create a new Reporting Module, we took a step back and tried to imagine what the ideal report system could provide. We thought about the different stages of report design, the features needed for powerful reports, the many types of data that we may want. We also listened to a lot of user feedback. We were amazed in the variety and quality of reports people created with the old Report Module, but repeatedly heard customers ask for something easier, something that felt more like the rest of Ignition. Trying to distill all these requirements into a singular workflow was no small task, but we believe this new workflow will be understandable to the new developer, yet powerful enough for a seasoned analyst. Make no mistake, reports have a lot of moving parts, but fear not! You'll be able to leverage our new tools to create impressive reports faster than ever!
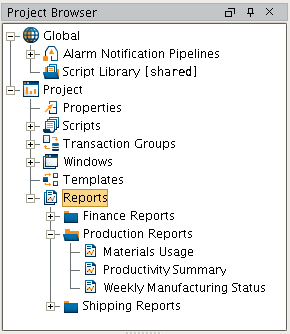
Reports are Project-Level Resources in Ignition 7.8
A New yet Familiar Workspace
So how do you create reports in Reporting v3? The new Report Workspace is the answer! Built from the ground-up to be intuitive and familiar, the new workspace has a logical workflow which makes it easy for anyone to create meaningful reports. From the first informative panel to full previews of the report you are creating, we believe this product will significantly cut the time it takes to design, edit and distribute reports. Lets take a look at the different parts of the new workspace.
The Reporting Workspace
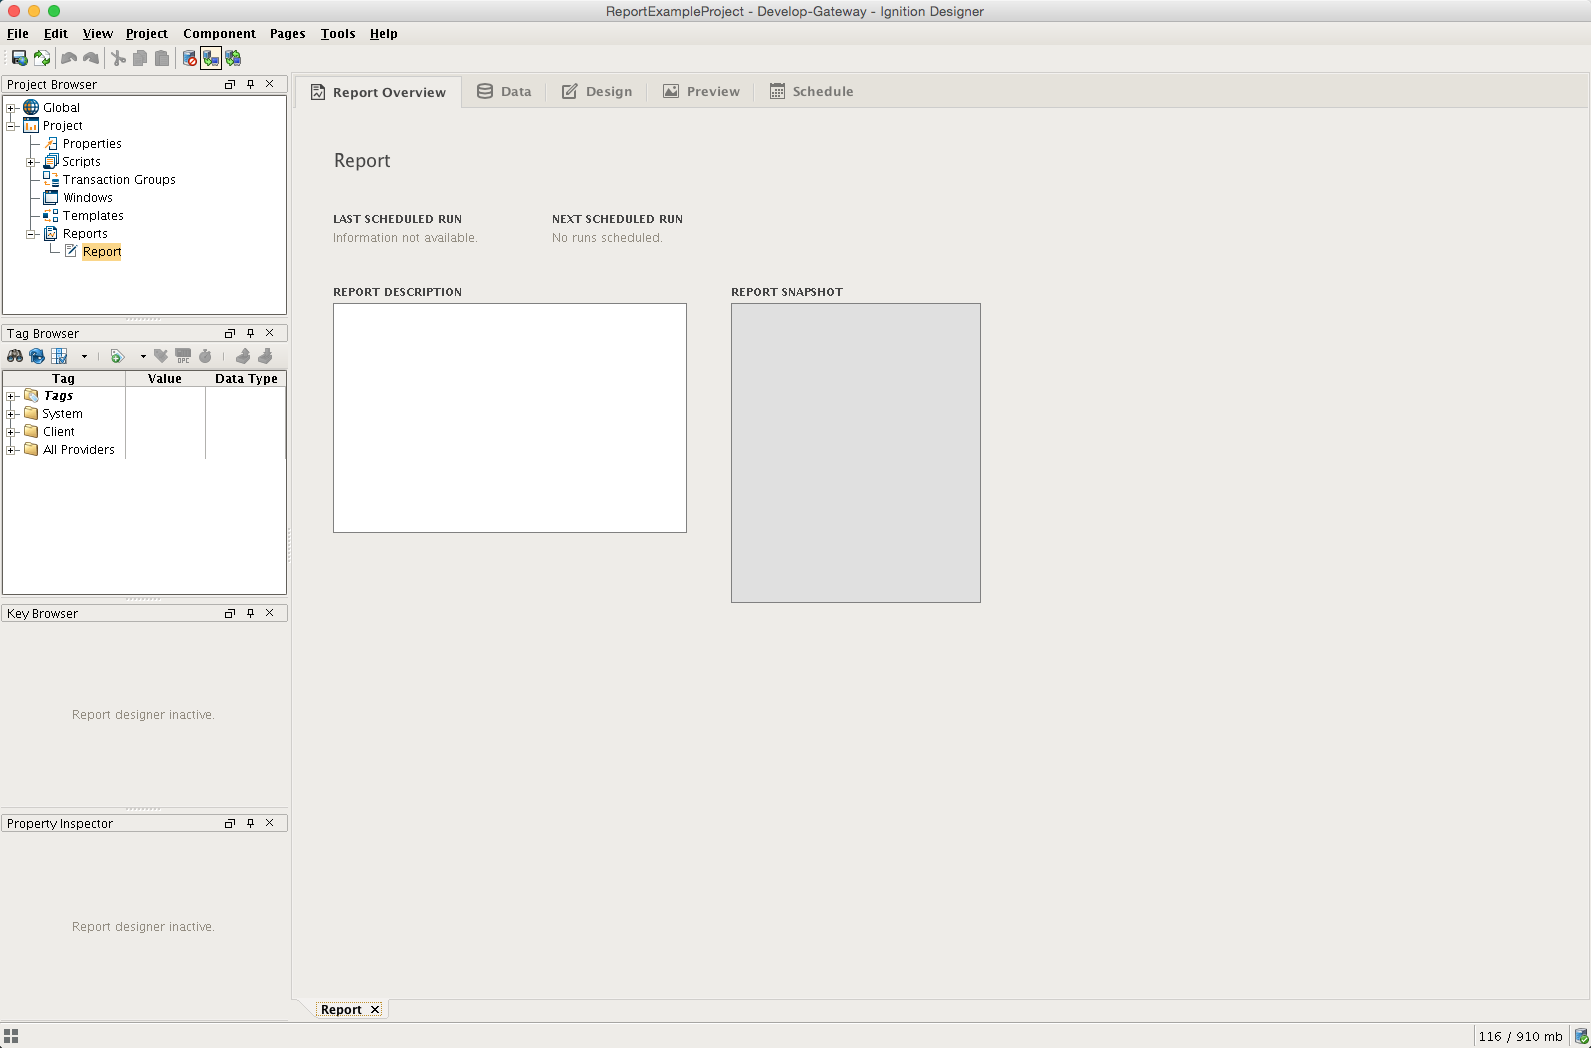
Report Overview
The first tab should be fairly self-explanatory – it provides some valuable quick-glance information about your report. There isn't much to see in a new report, but it can be a great introduction to an existing report for those new to a project, or if someone wants to quickly verify the schedule execution status of the report. There is space to add notes, which is a good place to provide background information and context about the report. The Overview will also show a thumbnail of the most recent report, its last execution time, and the next scheduled execution. The Report Snapshot is generated per visit to the Preview Panel.
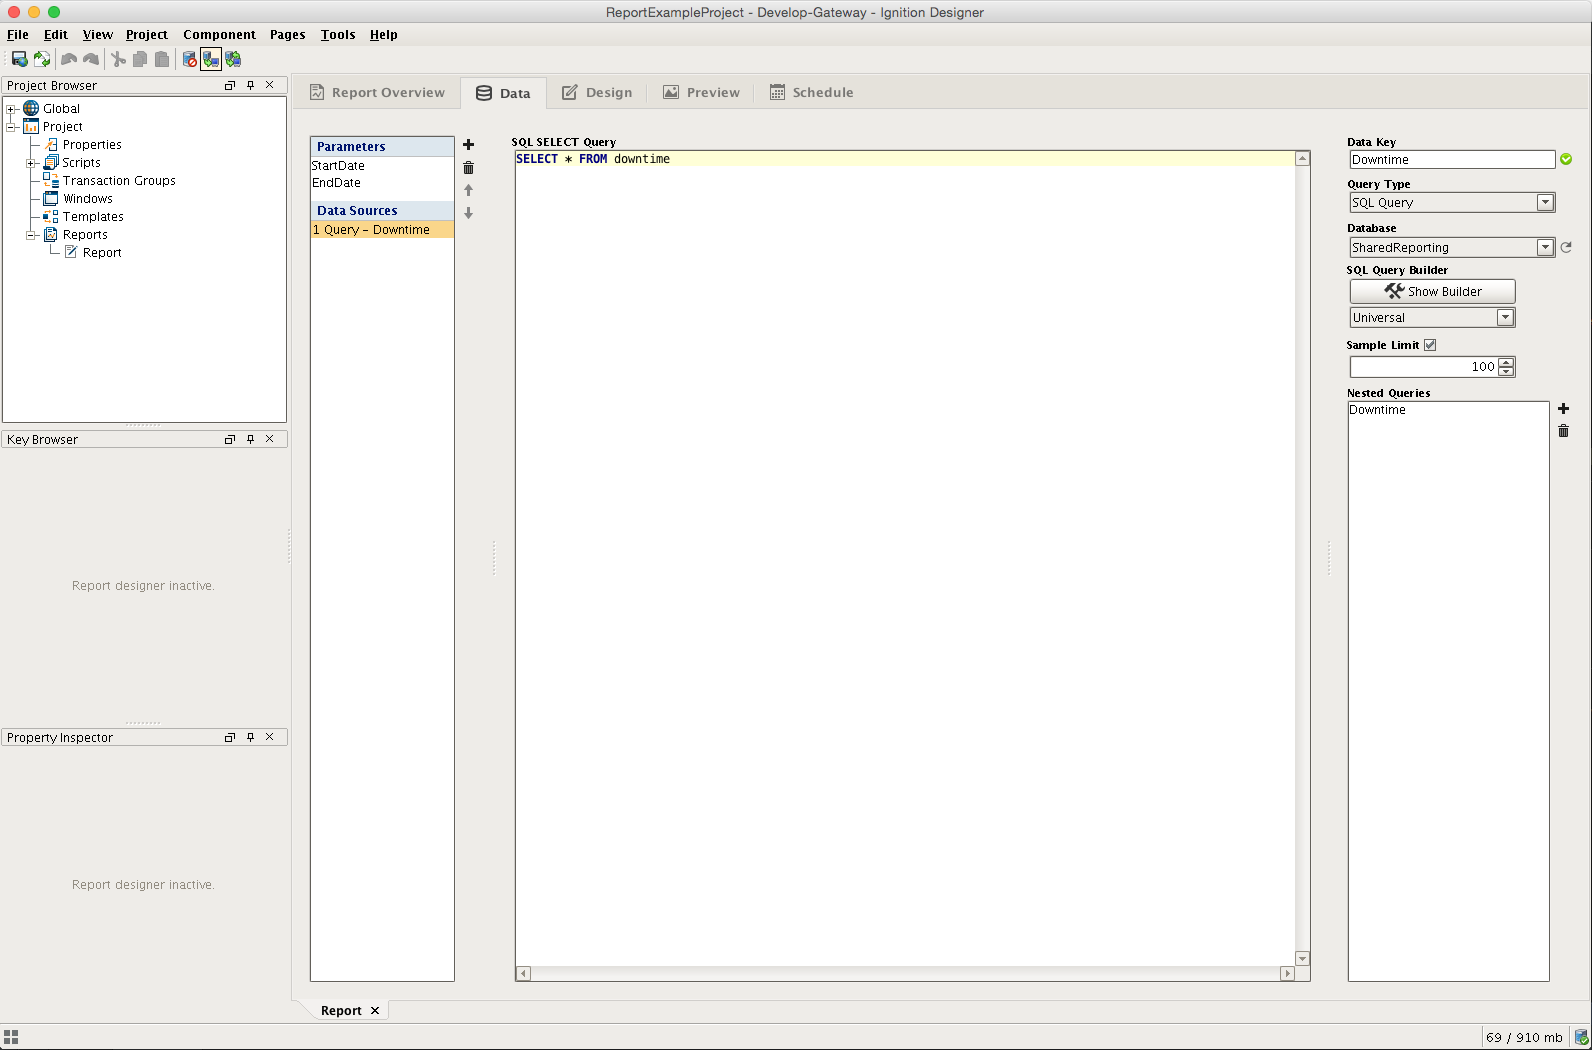
Data Panel
The Data panel is the first stop for configuring a new report. You'll notice the list on the left that has labels for Parameters and Data Sources, as well as some buttons. It is on this page where we can configure what data we want to make available to our report. The emptiness of a fresh Data Panel is very deceiving! We'll dive more into Parameters and Data Sources, but for now go ahead and click the + button. You'll see a list of built-in Data Sources and Parameters. Selecting any one of them will open the configuration screen for that Data Source type and allow you to start configuring the data you'll supply to your report.
By the end of this guide, you'll be comfortable adding data sources to power your dynamic report.
|
The Data Panel |
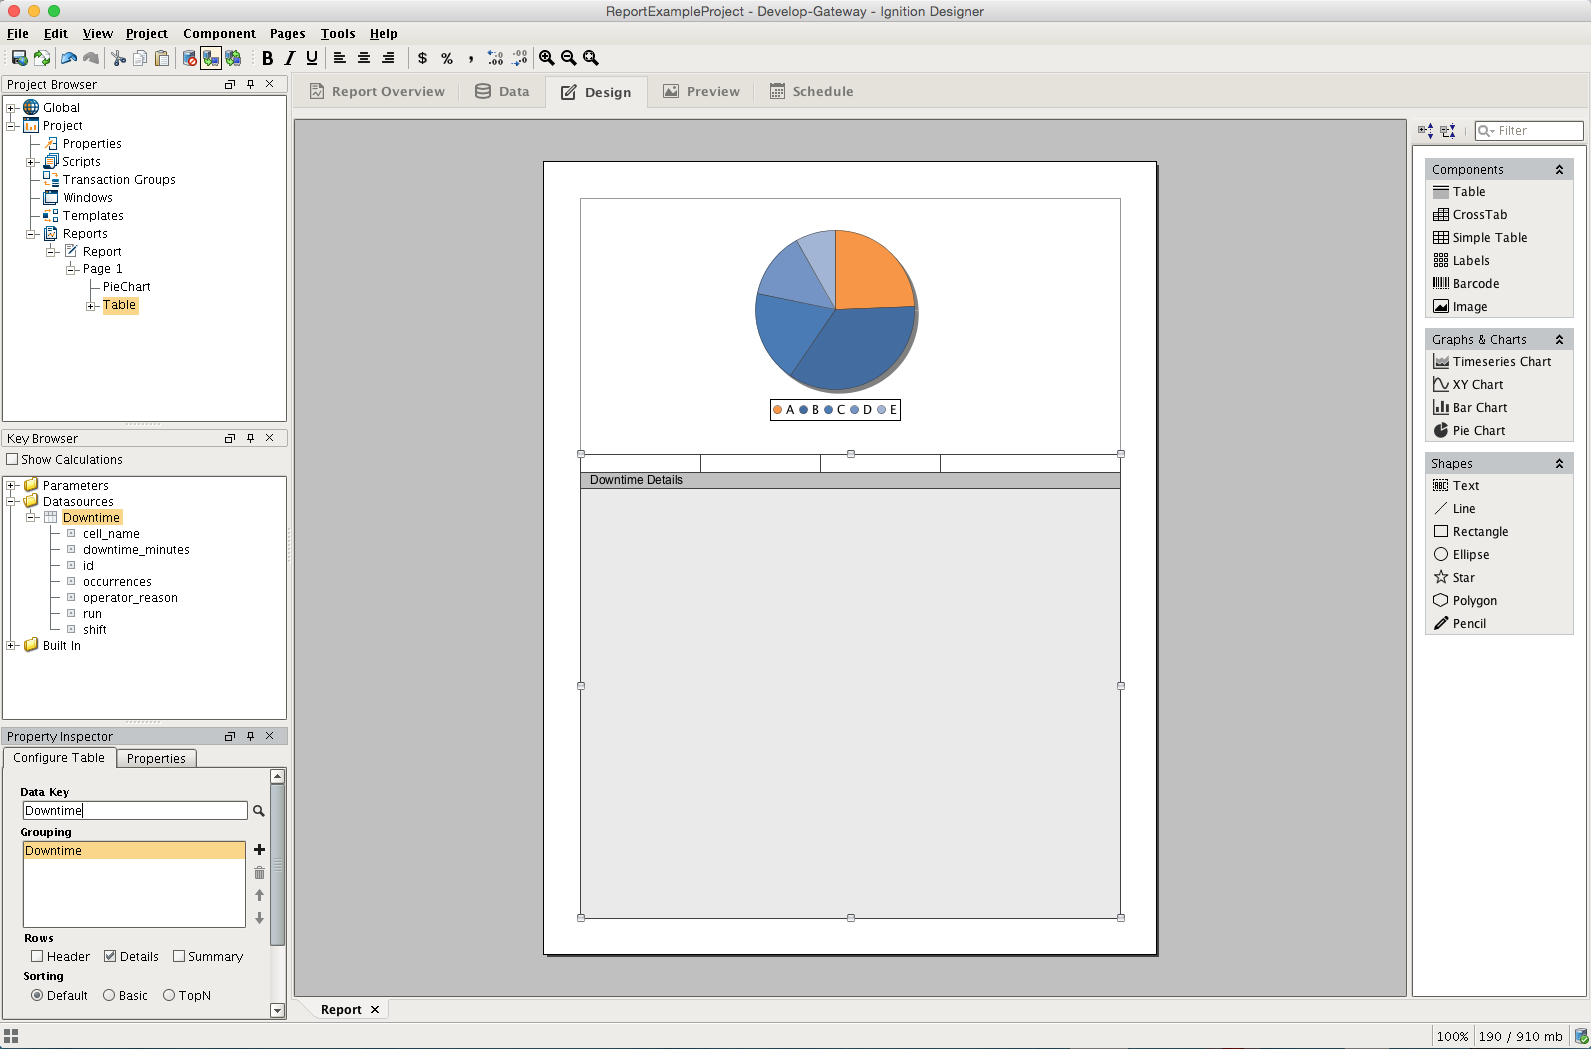
Design Panel
The Design Panel is something we expect to be a relief to those who felt the previous Vision Reporting Component didn't feel like Ignition. If you've ever designed a Vision Window, this should feel right at home. Starting from the top-left – the structure of a Report is now represented in the Project Browser tree, allowing easily visualization of the tree of elements on your report. But, we didn't stop there! Grab a component off the vision-like reporting palette and add it to the page. You'll see on the bottom left that we've completely re-written how you configure report objects. For complex components, we have built custom configuration panels to supplement the Property Inspector table that all the design objects have. In place of the Tag Browser, we now have a Datakey Browser that gives you an easy way to add the data sources you configured in the Data panel to the Report.
|
The Design Panel |
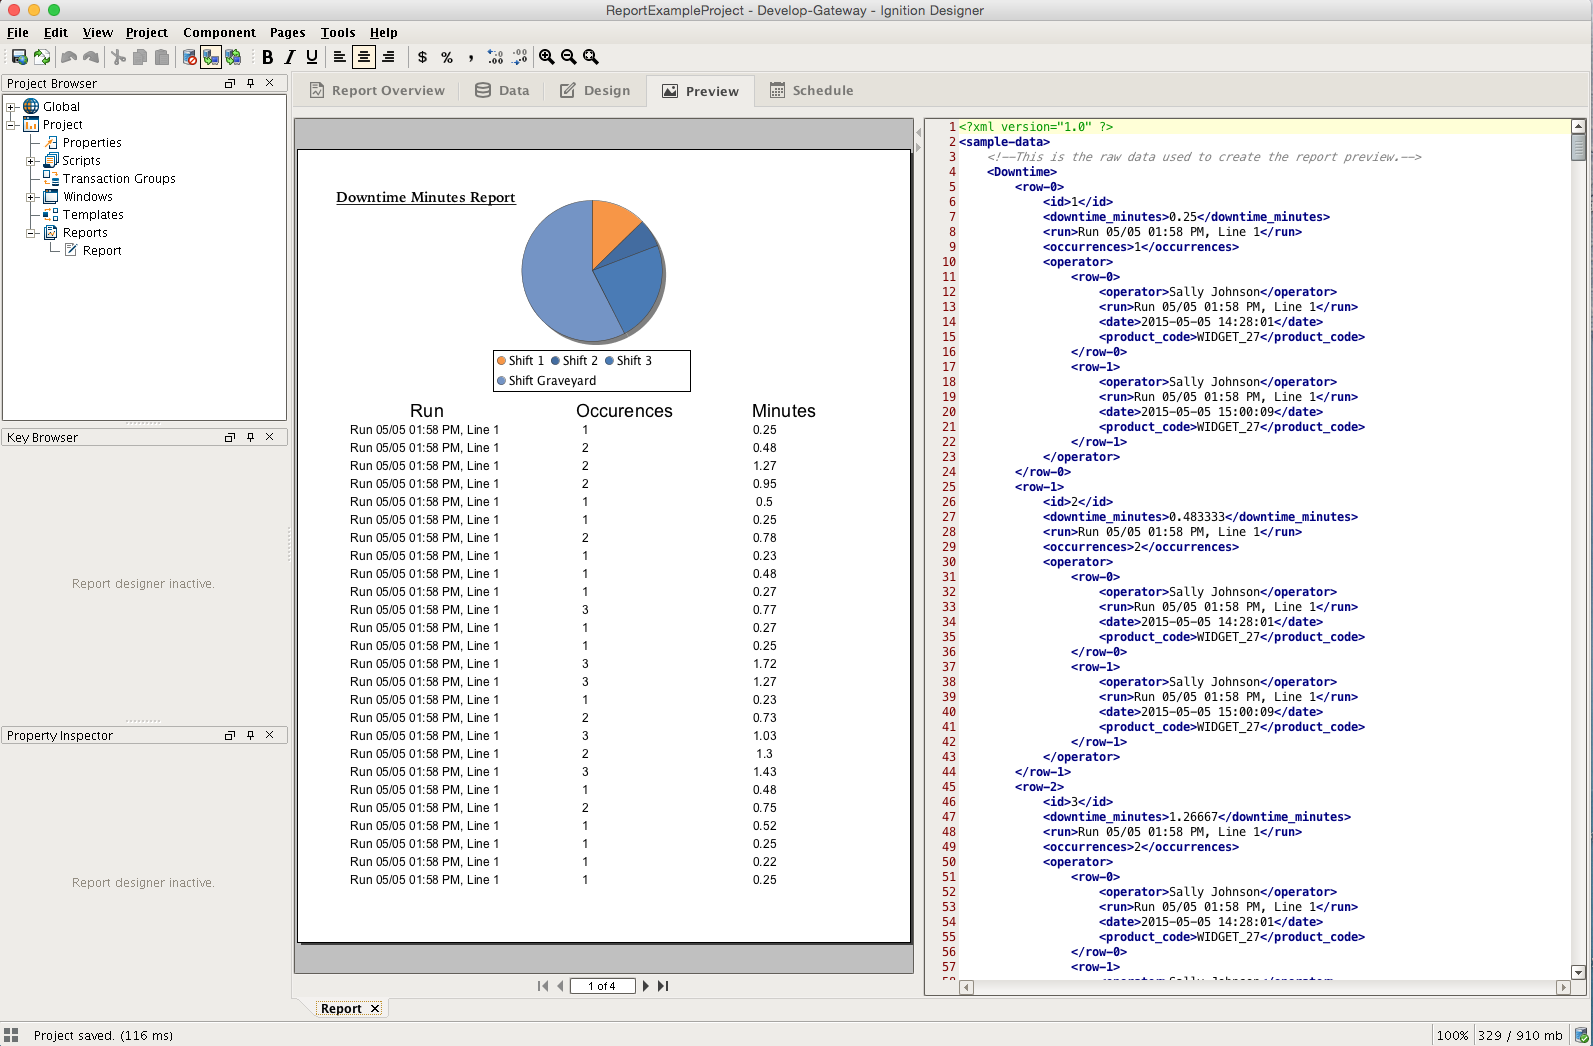
The Preview Panel
The Preview Panel, while not one of our 3 Steps, is a huge help while building your Report. By choosing to limit the amount of Preview data to return on the Data Panel, you'll be able to get fast visual feedback on your report without long-running queries. Not only does it provide you an instant example of what your report looks like, but it also gives you the ability to view the actual data that is being sent to your report! Having a snapshot of your data can be incredibly helpful when trying to figure out why your report doesn't appear as you expect it to. Whether you have a error in your Query, or a bad Data Key in a component, you'll be able to figure out the structure of the data your report is getting and quickly find ways to solve any problems.
|
The Preview Panel |
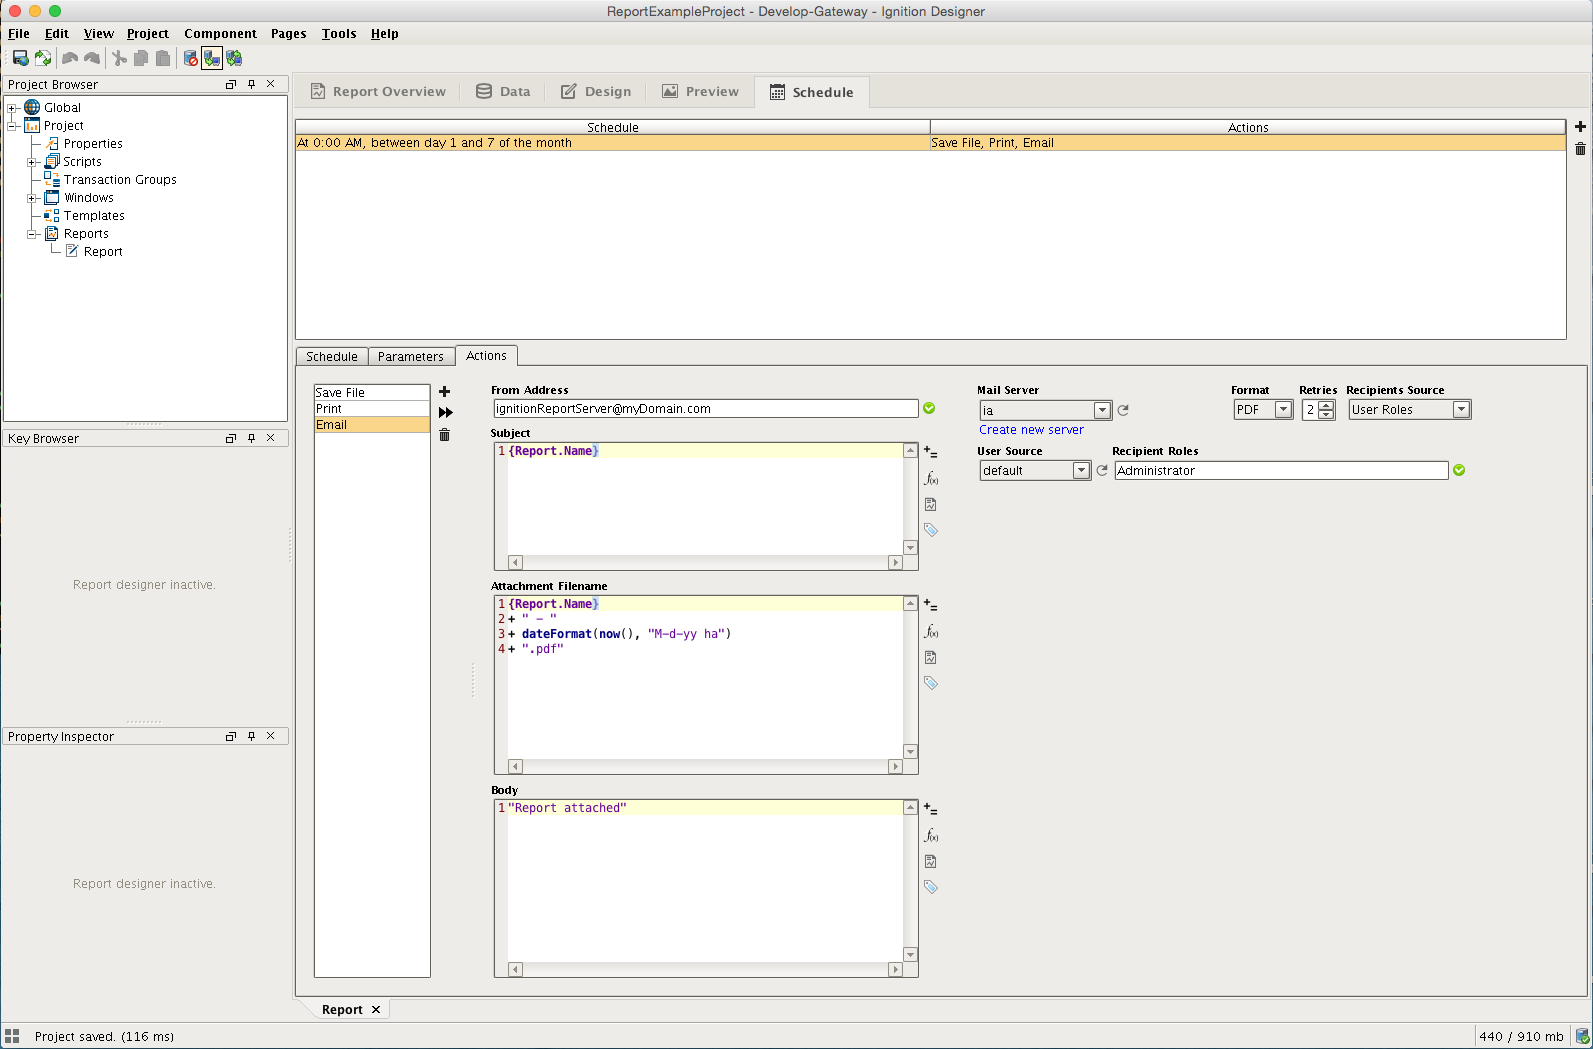
The Schedule Panel
If you tried to schedule the execution of a Report on previous version of the Report Module, you likely found that there really wasn't a simple way to succeed. With the new Reporting module, scheduled reports are a built-in and easy to use. The Schedule panel is an incredibly powerful way to automate the execution and delivery of your Reports. Whether you have extremely long running queries that you don't want tying up a window, need to deliver to multiple file servers via FTP, or want to simply email to an existing roster, this panel provides you the means to do it. It's broken up into two major areas. On top, you find a simple table of schedules that have been established. To add a schedule, click the + button. With a schedule added, you can now choose when and how that scheduled Action will occur. Our schedules use the common Chron format, but don't worry if you aren't familiar with it. The preset options and combo-box configurability allow you to easily create just about any schedule you can imagine.
Once you selected your schedule, you can add parameters that may affect your Actions. Actions are incredibly powerful and allow you to choose how you want to distribute or act on your finished reports. Whether saving a file locally, posting to an FTP server, or emailing (after you have configured your email connections in the gateway), you should be able to get your report where it needs to be. If our normal distribution Actions somehow fall short, you can choose to act on the finished report by triggering a script! We've also given you a convenient way of immediately testing your Action by simply clicking the  button on the Action tab.
|
The Schedule Panel |