Easy Chart - Subplots
This section assumes that tags and Tag History have been configured
To learn more, go to the Tag and Set up Tags to Log pages.
The examples below use OPC tags from the Generic Simulator driver, but Memory, Expression, and Query tags could be used instead.
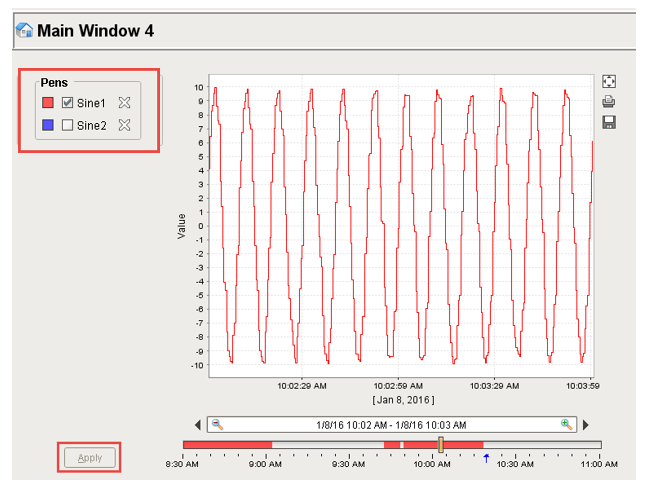
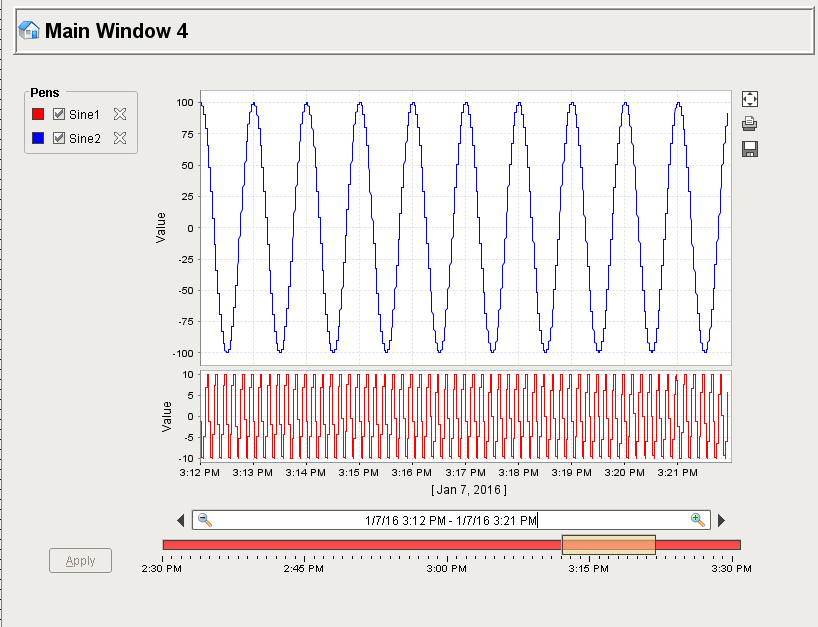
The subplot feature of the Easy Chart component allows you to break up the chart plot area into multiple distinct subplots that share the 'X' axis, but they have their own 'Y' axis. By default, the Easy Chart has one subplot which is the main white area shown in the example below. Both of the Sine tags are inside this chart which is why you are seeing the history for both tags in this one area.
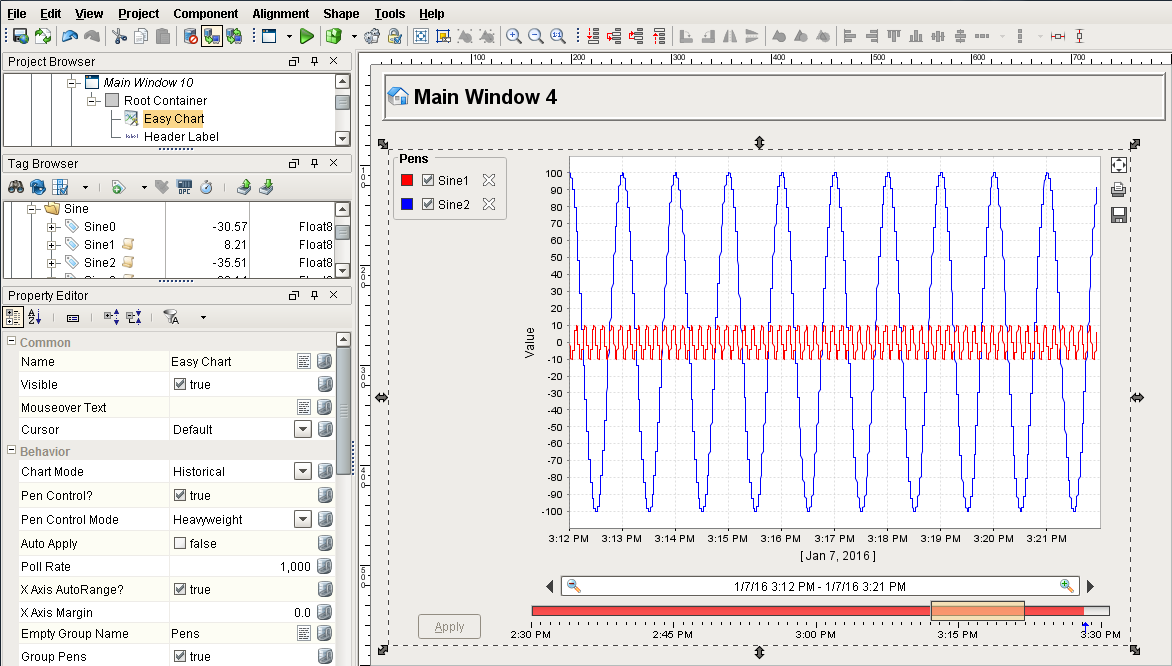
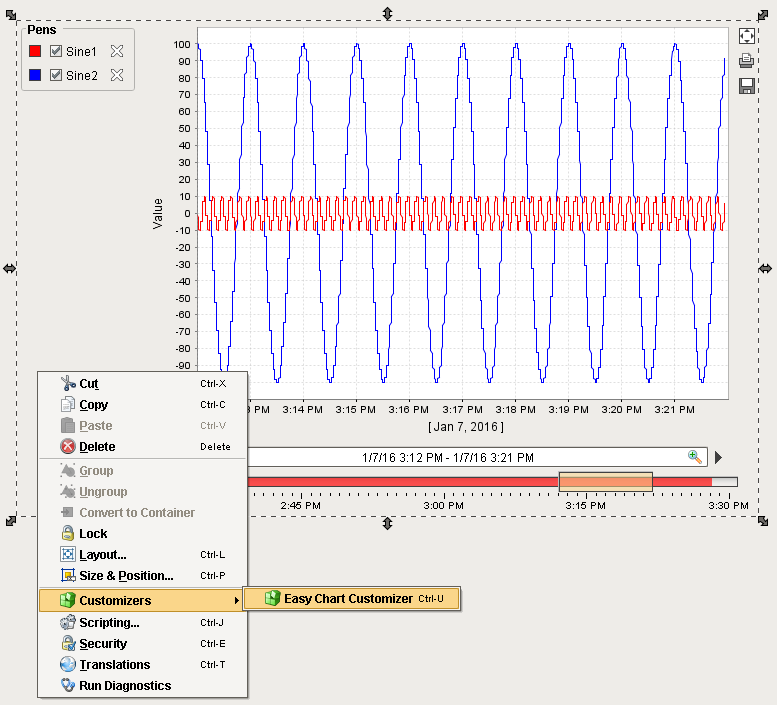
It’s possible to break up your tags into multiple subplots which is often useful for digital data. In this example, the Sine 1 tag represents digital data in the very center of the chart, but perhaps you may want it to be its own subplot. Right click on the Easy Chart component and scroll down to Customizers > Easy Chart Customizer.
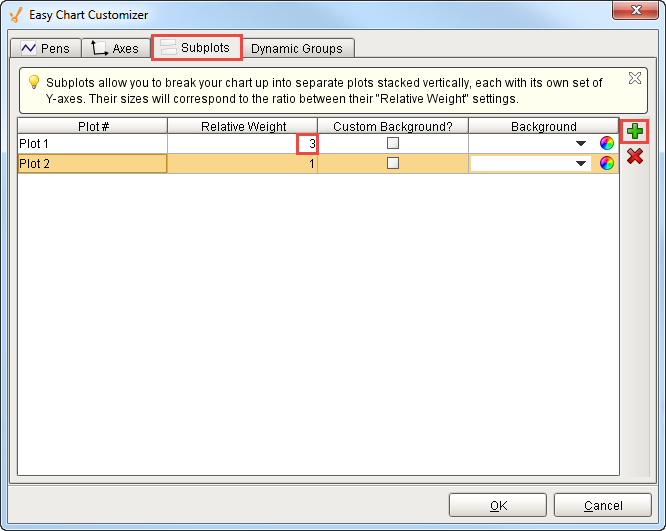
The Subplots tab allows you to add one or more subplots to your Easy Chart. In this example, there is one subplot with a Relative Weight of 1 and a white Background.
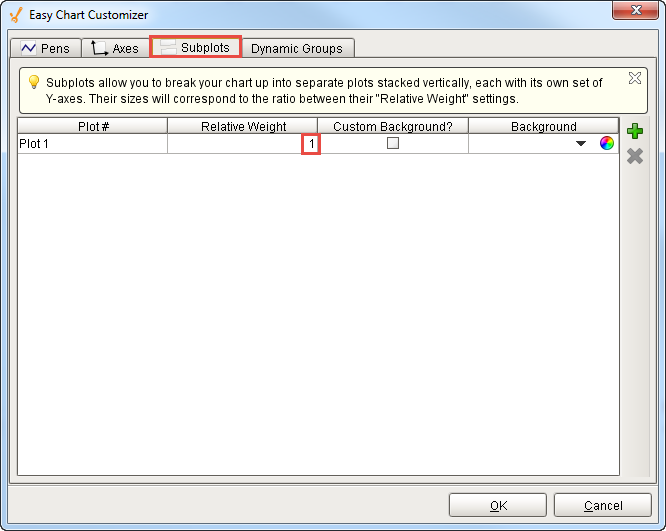
Click on the green plus icon to add a second Subplot and specify the Weight and the Custom Background. The Weight is the ratio between all the subplots. So, if you make the second subplot a 1:1 ratio, both subplots will share 50% of the space on the chart. In this example, make Subplot 2’s Relative Weight ‘1’ and Subplot 1’s Relative Weight ‘3’, then Subplot 1 will be 3 times larger than Subplot 2. This is very common for digital data.
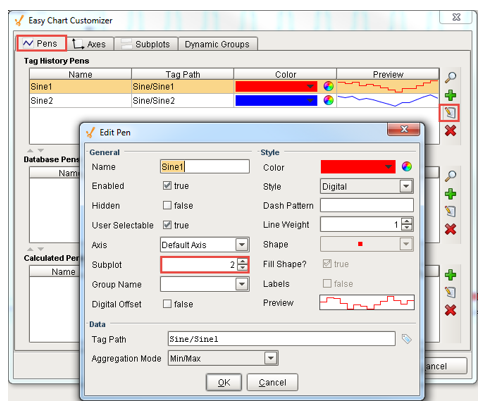
Now, we have to put one of the pens into a different subplot. Click on the Pens tab and select Sine 1. Since Subplot 1 contains digital data, edit that pen to put it into Subplot 2. Increment the spinner to ‘2’ or type the value ‘2’ in the Subplot field. Press OK.
Press OK again and now you have 2 different distinct plots on the Easy Chart. The second subplot on the chart has the digital data values and the top subplot has the Sine 2 tag values. You are not limited to the number of subplots on one Easy Chart.
You can view one subplot at a time by unchecking the tag in the Pens box and clicking Apply. The Easy Chart only shows subplots that have active tags.