Chart Flow and Rules
Understanding Flow
Similar to how water flows down a river, execution of a Chart flows along one or more paths. When a Chart is running, flow typically moves from top-to-bottom. To reinforce this concept, Begin Steps only flow down, and End Steps only accept flow from the top.
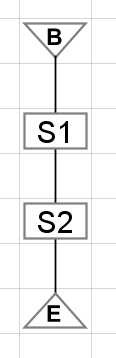
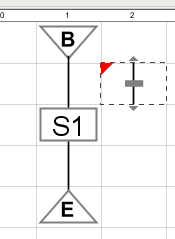
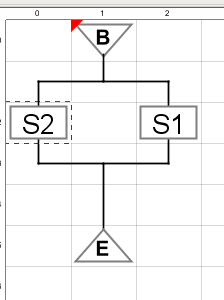
In the Chart below, execution begins at the Begin Step (B), flows down into the first Action Step (S1), flows into the next Action Step (S2), and then into the End Step (E).
Vertical movement
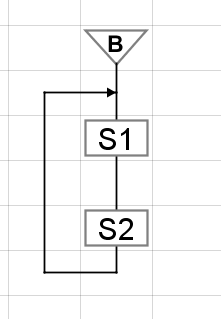
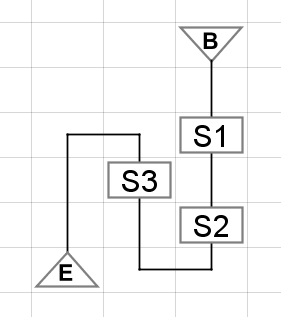
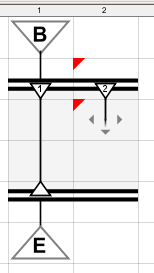
While charts generally flow from top-to-bottom, they can advance bottom-to-top. This allows for looping logic to be built directly into the Chart: the Chart will loop around until something either redirects the flow, or cancels the Chart.
In the image below, the Chart will flow out from the bottom of S2, travel up, and loop back around to the top of S1. The Chart will continue looping around until canceled.
Determining when to proceed
Before flow may exit from an Action, the following requirements must be met:
-
A sequential step must be available. Flow of the chart must be able to reach a step, such as another Action Step, or an End Step. Transitions are generally used to control the availability of steps.
-
The active step must be ready to finish. Action steps may have a script running when the next Transition opens or returns "true". As soon as an available path is ready, the step will finish any running scripts, and then flow will move on. In situations where a script may take a long time to finish, this waiting prevents partial execution, and guarantees that any attached scripts will be allowed to finish.
Once both condition are true, flow continues.
Directing flow
After exiting an element, flow of the Chart may branch off into multiple potential paths. When multiple paths are present, the Chart will choose a single element. Transitions are used to help coerce flow of the Chart when multiple paths are available. When the expression on a Transition resolves as true, flow may proceed through. When a Transition resolves as false, flow is halted.
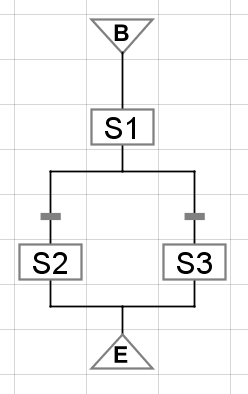
In cases where multiple open Transitions are present, flow is biased towards the left-most path. In the image below, flow exits from S1, and has two possible paths. When both Transitions are true, flow will always take the left path, so S2 would execute next. In this scenario, S3 would be ignored.
In most cases, Transitions will not statically be set to a true value. By implementing more meaningful expressions on the Transitions, the Chart can determine which path to take while running. Furthermore, as long as both Transitions are false, flow of the chart will be blocked, waiting for one of the Transitions to become true. This structure is very similar to a logical OR: if either Transition is true, flow will continue.
Chart Rules
When developing a chart, there are several rules to keep in mind. Violating some of these rules will result in compilation errors on the Chart. The Designer's interface will report any chart errors in the Chart Design section.
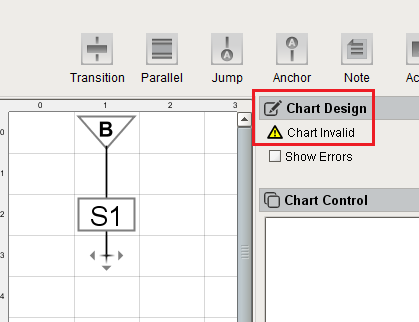
When enabled, the Show Errors checkbox will highlight problem areas on the chart, as well as show the error when the mouse cursor is moved on top of the problematic area.
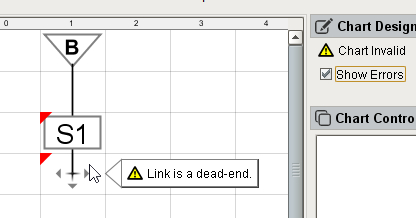
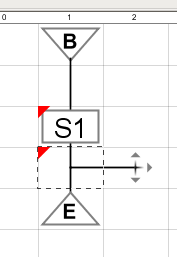
Flow must always lead into the top of an Element.
While moving bottom-to-top is legal, flow may never enter the bottom of an element. If the flow leads to the bottom of an element, it is considered a dead-end, and the Chart will fail to execute.
The image below demonstrates an illegal Chart. This Chart will not execute because the flow from S2 is attempting to lead into the bottom of S3.
All Elements must be connected to the Chart
Every element present should be linked to other elements in the chart. Rogue elements should be removed before the chart runs.
All Links must lead to an Element
Links must connect to an element. Any link that is not connected is considered a dead-end, and must be removed.
This rule extends to links created inside of a Parallel element.
Flow may not lead into multiple Actions
Outside of a Parallel element, only a single Action should run at any time. Flow that leads into multiple Actions will cause a compilation error because the chart does not know which Action to run. In cases where the Chart flows into multiple Actions, Transitions should be used to guide the flow. If multiple Actions must execute simultaneously, a Parallel element should be used.
Charts do not need an End Step
Flow of the Chart must always lead somewhere, but an End Step does not have to be used. Charts can freely loop around indefinitely. If flow is blocked by a Transition, then the Chart is effectively awaiting input to execute.
Chart Lifecycle
Each running chart is effectively a finite-state machine: the Chart can be in one of many different states, but it is only ever in a single state at any given moment. The current state of the Chart carries significant meaning.
The figure below shows each potential state a chart can be in, and outlines which states are accessible from each other state.

Active States
The following states are common to the lifecycle of a running chart.
|
State |
Description |
|
Starting |
The Chart begins. The On Start Event Script triggers at this point. |
|
Running |
The Chart flows through its structure. Running charts generally spend most of their time in this state. |
|
Pausing |
When the Chart is requested to pause, it moves into this transitional state. The Chart will attempt to finish execution on all active scripts, and will not start any additional scripts. Once all scripts have successfully finished, the Chart will transition to the Paused state. Charts may be paused from either the Chart Control section of the Designer, or by calling system.sfc.pauseChart. |
|
Paused |
The Chart will sit here indefinitely until requested to resume, or is canceled. This is an idle state where the Chart does not take any actions unless requested to do so. |
|
Resuming |
Once requested, the Chart will start up and briefly enter this state. Resuming a chart can be done from the Chart Control section of the Designer, or by calling system.sfc.resumeChart. |
Terminal and Intermediary States
Charts have three different terminal states, or end states. Terminal states denote that the chart has ended due to some reason. There are also three intermediary states that lead to the terminal states. When a chart ends in some way, the Chart transitions to an intermediary state before moving to the associated terminal state. This allows the Chart a chance to do some closing work before ending. The intermediary states are as follows:
|
State |
Description |
|
Stopping |
The Chart has reached an End Step, and will stop soon. In most cases, this is the preferred terminal state as the Chart successfully reached its end. The On Stop Event Script will trigger at this state. Once finished, the Chart will transition to the Stopped state. |
|
Aborting |
The Chart has encountered some sort of error, and must end abnormally. The On Abort Event Script will trigger. Once On Abort ends, the Chart will transition to an Aborted state. |
|
Cancelling |
Something requested the Chart to cancel, or end before reaching the End Step. The On Cancel Event Script will trigger, and the Chart will transition to a Cancelled state. Cancelling can occur from the Chart Control section of the Designer, or by calling system.sfc.cancelChart. |
What are there three different terminal states?
All three terminal states essentially mean the same thing for the Chart: the instance will no longer run. The differences is how the Chart ended. When troubleshooting, it is helpful to know why a Chart ended; did it finish successfully, was there an error that prematurely ended the Chart, or did something request that the Chart stop?
Understanding how the Chart ends can greatly aid in tracking down any problems. To that end, it is highly recommended to place scripts on the On Abort event. This will clearly log when a chart failed.
Similar Topics ...