Report Data
Data Queries
The most critical part of any report is data. Without data, there is nothing to report! In the Reporting Module, all data is collected as either a Parameter, or a Data Source. You can use these together to create simple, on the fly reports for your users.
Parameters
Parameters are the way you get dynamic data into your charts. These properties are exposed on the Report Viewer component and can be bound to other components to allow your users to select what report data they want to see. You can use these to set up dates, time ranges, area selectors, titles, and anything else you want in your report.
By default, StartDate and EndDate properties are automatically created for you because they are almost always used to filter report data. Of course you can delete them if you don't need them.
Data Sources
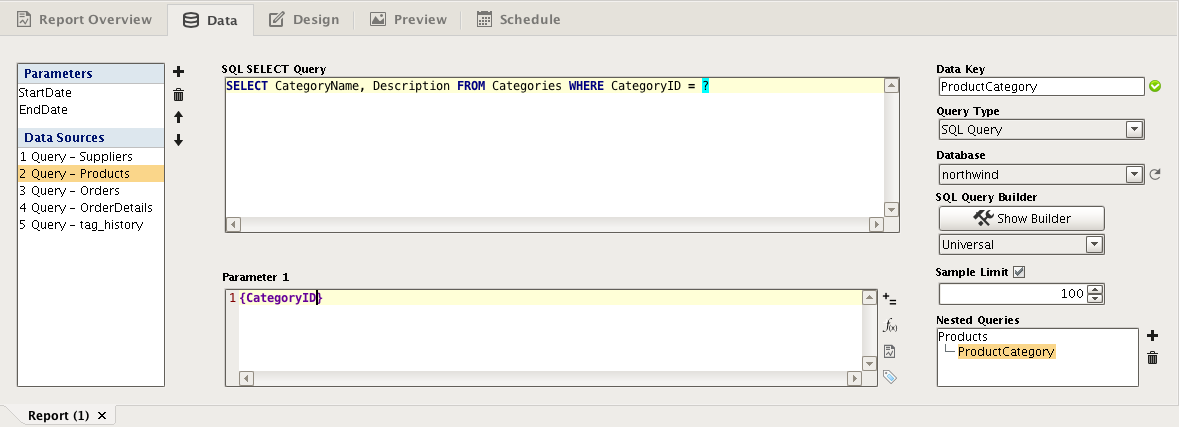
Data Sources are the properties that hold the bulk of your data. This is where you will set up dataset property types and pull in data based on your Parameters. There are several types of Data Sources:
-
SQL Query: a straightforward query that allows parameters to be inserted with question marks (?) and has a graphical Query Builder
-
Basic SQL Query: a simplified version of the SQL Query that supports references directly in the query using the brace characters { }
-
Tag Historian Query: the same Tag History query builder you are familiar with from property bindings
-
Tag Calculation Query: similar to the Tag Historian query, but this one allows calculations to be performed on the resulting data (min, average, duration on, count off, etc.)
-
Alarm Journal Query: the same alarm journal query builder you are familiar with from the Functions property binding
-
Script: a blank script that you can use to create a dataset in any way you like
-
Static CSV: copy and paste static CSV data directly as an easy way to test your reports
Nesting Queries
All of the Data Source types can have nested queries in them. That is, for each row of returned data, a second query can be run based on the results in that row. You can have multiple sub queries for each row, and you can nest queries as deep as you want. This is particularly useful when you have data organized into runs, and want to see historical data for each run.
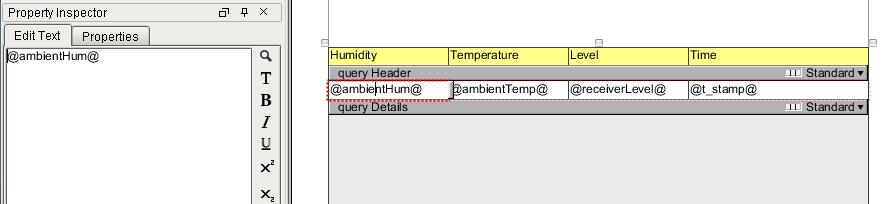
Data Keys
Once your data queries are set up, it's simple to get your data into the report. In the design section of the Reporting Module, we use Data Keys and (optionally) Keychain Expressions to feed the report from the data sources. A Data Key is a reference that points to a Parameter or a column in a Data Source and looks like: @ParameterName@. At report generation time, these keys resolve to the values (or sets of values) provided by the data source. In simple terms, Data Keys are placeholders for your data.
In This Section ...