CrossTab Table
The Cross-Tabulation or CrossTab  component is a tabular data element like the Table and Charts. Also known as Contingency Tables, they are commonly used to summarize the relationship between two categories of data by showing summaries of cross sections of the data source. To be useful, crosstab data should have the following:
-
Lots of repetitious data. Sums, Averages, and other Aggregating functions are well represented by crosstabs.
-
A data source that provides at least two columns of data which are repetitious compared to the number of rows.
-
One or more columns that represent a value that requires calculation. Examples are: summing money, displaying average response times, counting occurrences, etc. These calculations may be provided as columns or calculations of the data source, or as Keychain Expressions.
Usage
The CrossTab template is much simpler than the table template. By default it just shows one cell of a simple table. This is usually configured with an aggregate key, like "@total.getAmount@". After that, grouping keys are dragged to the horizontal and vertical axis.
Example
First, create a Static CSV data source with the following data. (Double click the text to select it) Name the data source "Downtime_By_Site"
Equipment,Time,SiteMotor,15,Site AMotor,23,Site AConveyor Line,148,Site BPallet Wrapper,58,Site AMotor,96,Site CConveyor Line, 23, Site BPalletizer,40,Site BConveyor Line,56,Site APallet Wrapper,45,Site CMotor,43,Site C
For example, your dataset might look like this:
|
Equipment |
Time |
Site |
|
Motor |
15 |
Site A |
|
Motor |
23 |
Site A |
|
Conveyor Line |
148 |
Site B |
|
Pallet Wrapper |
58 |
Site A |
|
Motor |
96 |
Site C |
|
Conveyor Line |
23 |
Site B |
|
Palletizer |
40 |
Site B |
|
Conveyor Line |
56 |
Site A |
|
Pallet Wrapper |
45 |
Site C |
|
Motor |
43 |
Site C |
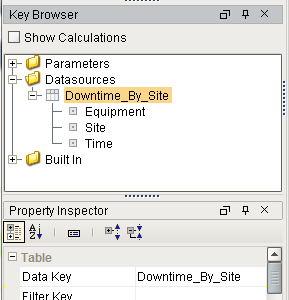
Next, switch to the Design panel and create a new CrossTab component. With the CrossTab component still selected, drag-and-drop Downtime_By_Site from the Key Browser to the Data Key property in the Property Inspector
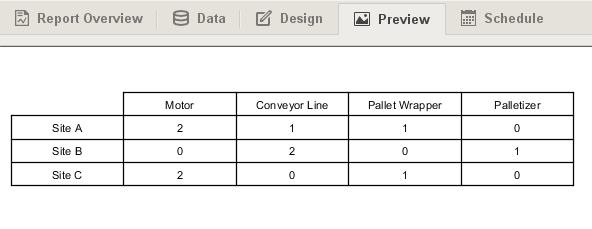
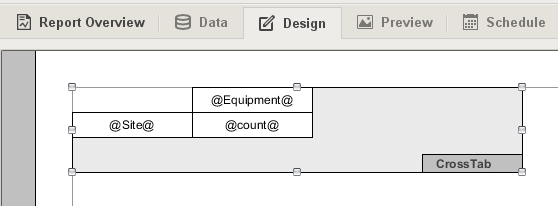
Now we need to add some data keys to the cells in the CrossTab component. We'll add @Equipment@ to the top cell, @Site@ to the leftmost cell, and @count@ to the remaining cell. This will show a count of each piece of equipment by site. The CrossTab should look like the following:
Switch to the Preview panel and your cross tab will display the results