Scripting in Reporting
Scripting in the Report Module
The Report Module allows you to use scripting in several ways to extend the existing functionality. You can use some or all of these to extend the flexibility of Ignition's Report module. If the existing builders aren't enough, Ignition offers scripting for you to create exactly the functionality you need.
-
Data Sources: There is a Script Data Source type that allows you to create your data set in any way you like. You can alter other Data Sources, combine results, do complex calculations and more.
-
Scheduling: There is a Run Script action in the Report Scheduling system. If the existing print/email/save/FTP Actions aren't flexible enough, create a script to do exactly what you want with a generated report.
-
Scripting Functions: The Report Module adds additional functions to the list of system.* functions available throughout Ignition. You can use these functions to execute and/or distribute reports on demand.
-
Editing Charts: The Chart components in the Report Module are completely customizable.
Script Data Source
The Script data source allows you to add additional data into a report. Script data sources are able to reference data keys from other data sources. This allows you to modify keys from one data source, and return a new altered data source.
Alter Dataset Example
Say we have a query data source named "Area Data" which contains four columns: month, north_area, south_area, and t_stamp. If we need to build a new data source without the t_stamp column we can use the following code:
#build a header and initialize a pydataset header = ['month', 'north_area', 'south_area'] filteredDataset = [] #get the results from the Area Data data source rawDataset = data['Area Data'].getCoreResults() #build the new pydataset out of only some of the Area Data's data keys for row in range(rawDataset.rowCount): valCategory = rawDataset.getValueAt(row,'month') valNorthArea = rawDataset.getValueAt(row,'north_area') valSouthArea = rawDataset.getValueAt(row,'south_area') filteredDataset.append([valCategory,valNorthArea,valSouthArea]) #convert the pydataset to a standard dataset filteredDataset = system.dataset.toDataSet(header, filteredDataset) #create a new data source with the filtered results data['updated Area Data'] = filteredDataset 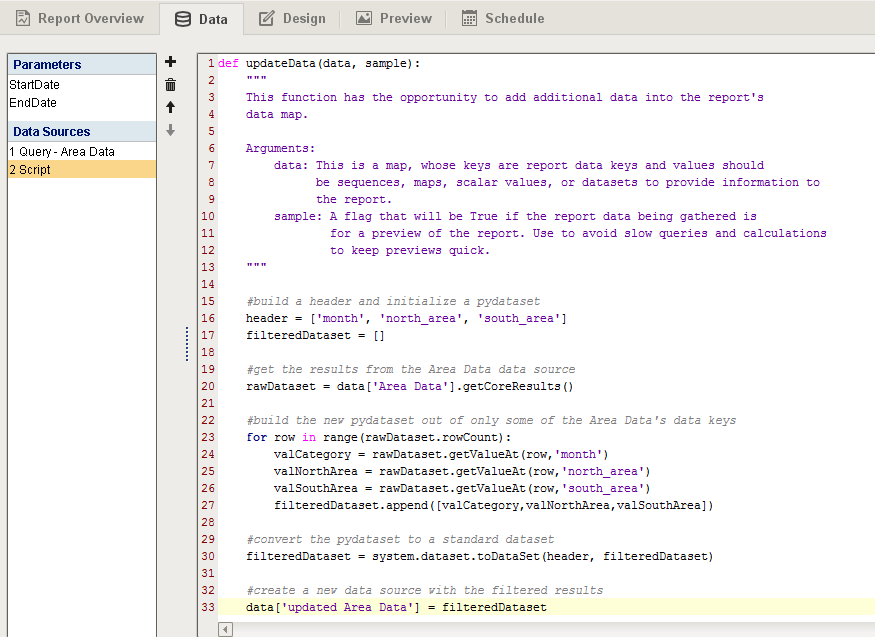
The above code would create a new data source in the Design panel named 'updated Area Data'. Note that .getCoreResults() is only applicable when the raw data source is a query. If 'Area Data' in the example above was a static CSV then you could get the data into a 'new data source' with the following:
data['new data source'] = data['Area Data']What if our 'Area Data' query has a nested query called 'Area Details' that we would like to manipulate in a script?
nested = data['Area Data'].getNestedQueryResults() # Gets results from our parent querysubQuery = nested['Area Details'] #Gets the subquery we want -- there can be more than oneheader = ['productName', 'cost', 'triple']alteredDataset = []for child in subQuery: children = child.getCoreResults() # children is a dataset for row in range(children.rowCount): valProductName = children.getValueAt(row,'productName') valCost = children.getValueAt(row,'cost') valTimesThree = None if valCost != None: valTimesThree = 3 * valCost alteredDataset.append([valProductName,valCost,valTimesThree])#convert the pydataset to a standard datasetalteredDataset = system.dataset.toDataSet(header, alteredDataset)#create a new data source with the altered resultsdata['Updated Area Details'] = alteredDataset
Scheduling Action
The Run Script action is a scripting event that executes based on the schedule. This action does not inherently email, save, or otherwise distribute a report unless you do so in the script. However you can easily use executeAndDistribute() to send out the report.
Run Script Example
The following would insert a copy of the report into a database table
# the handleFinishedReport function provides reportName and reportBytes for us# save a copy of the report in the databasequery = "INSERT INTO report_log (name, data) VALUES (?,?)"system.db.runPrepUpdate(query, [reportName,reportBytes])
System Functions
The Reporting Module provides convenient scripting functions in system.reporting section that enable report generation from scripting. These reports can be generated in teh Client scope, or in any Gateway scoped scripts. It is useful to generate a report in the Gateway scope because you can then email or save it without ever opening a client.
Execute Report
Will immediately execute a report on use and return a byte[] array of the results. See executeReport() in the appendix.
# sample:# system.report.executeReport(path, [project], [parameters], [fileType]) # execute the reportreportName = "MyReport"reportBytes = system.report.executeReport(reportName) # save a copy of the report in the databasequery = "INSERT INTO report_log (name, data) VALUES (?,?)"system.db.runPrepUpdate(query, [reportName,reportBytes])Execute and Distribute
Will generate a report and distribute it by the configured Report Schedule Actions. See executeAndDistribute() in the appendix.
# sample:# system.report.executeAndDistribute(path, project, [parameters], action, [actionSettings]) # create and distribute (save) the reportsystem.report.executeAndDistribute(path='MyReport', project='my_project',action='save', actionSettings={'path':'C:\\Saved_Reports_Folder','fileName':'SavedReport.png','format':''png'})Get Report Dataset
This function will return a dataset with the names and paths of all reports for a given project.
# sample:# system.report.getReportNamesAsDataset(project) # get a datasetexistingReports = system.report.getReportNamesAsDataset('my_project')Get Report List
This function will return a list with the paths of all reports for a given project.
# sample:# system.report.getReportNamesAsList(project) # get a datasetexistingReports = system.report.getReportNamesAsList('my_project')
Editing Charts
The most common configuration options for charts are found in the properties panel, but almost every part of a chart can be configured through scripting.
To turn on configuration scripting in a chart, select the chart, scroll to the bottom of the Chart Options tab, enable scripting and click on Edit Script.
Change Legend Font Example
Say we want to change the font used in a charts labels. We can use the following code:
def configureChart(chart): # This configures the legend on a report chart to use a large, bold, monospaced font from java.awt import Font legend = chart.getLegend() # http://www.jfree.org/jfreechart/api/javadoc/org/jfree/chart/JFreeChart.html font = Font(Font.MONOSPACED, Font.BOLD, 48) # https://docs.oracle.com/javase/7/docs/api/java/awt/Font.html legend.setItemFont(font) # http://www.jfree.org/jfreechart/api/javadoc/org/jfree/chart/title/LegendTitle.htmlThe above code would change the font used in the chart's legend to a 48 point bold monospaced font. The comments give links to the APIs used in each line of the code.
Similar Topics ...