Dataset Grouping
Dataset Grouping breaks tables down by keys that share a common value. Tables support an arbitrary level of groups. Each can have its own Header, Detail, and Summary rows. Additionally, totals and other keychain functions are supported for any level of grouping.
Separating Groups with Page Breaks
Selecting the  option will create breaks between each Grouping. Each new instance of that level of grouping will create a new page in the report.
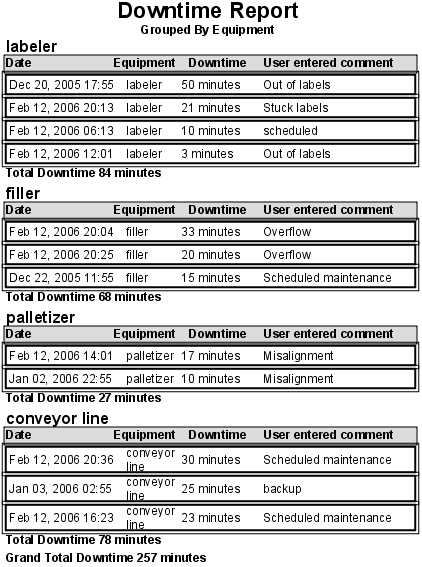
In the example above, separating the equipment level of grouping by page would create separate report pages for the following: labeler, filler, palletizer, and converyor line.
Example
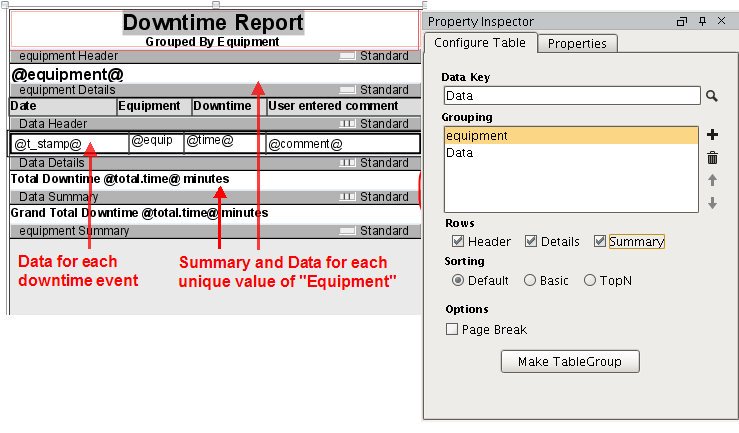
This example begins with a table similar to that created in the Table Basics tutorial. We'll group our existing downtime report table by equipment.
-
Drag the equipment data key from the Key Browser to the Grouping field of the Table Configuration panel, or select the
 button.
 -
Enable Header, Detail and Summary rows.
-
Add your header and details.
-
Use @total.time@ for both summary rows. Notice that the total respects grouping.
In the equipment Summary row total.time is a sum of all time at that level of grouping, which includes all downtime events. In the Data Summary row total.time is a sum of all downtime at that level of grouping, total time that has already been grouped by equipment, equivalently, total downtime by equipment.
Drag and drop a key from the Key Browser to the selected Table's Grouping configuration list to add it to the Group.