Report Tables
Overview
Tables are a major part of Ignition Reporting. They are composable and highly flexible, giving Reporting users the ability to flexibly layout and organize tabular data.
Tables are objects that display data in a structured, repetitious format. Their complexity can range from trivially simple to complicated, but fundamentally they do the same thing - take the data given to them and repeat structured row for each row or set of data provided. The Reporting engine will automatically create new pages to fit all data within the table's boundaries while applying your formatting preferences (such as font, size, layout and alignment) each step along the way. Combine that feature with powerful data manipulation and expressive layout tools, and you get an object that often forms the basis of your reports.
 We'll start by taking a look at the various parts of the base table component and move into more features and example.
The Table Component
The Table ![]() component can be created by dragging it from the Report Design Palette, or by simply dragging a Data Source from the Key Browser to a page in your report. A new Table with no bound Data Key is fairly simple looking, but hides a wealth of functionality. To best understand how to use a table, you'll want to have some familiarity with the Report Design Basics we cover in the design introduction. Selection and Super Selection are particularly important when dealing with Tables.
component can be created by dragging it from the Report Design Palette, or by simply dragging a Data Source from the Key Browser to a page in your report. A new Table with no bound Data Key is fairly simple looking, but hides a wealth of functionality. To best understand how to use a table, you'll want to have some familiarity with the Report Design Basics we cover in the design introduction. Selection and Super Selection are particularly important when dealing with Tables.
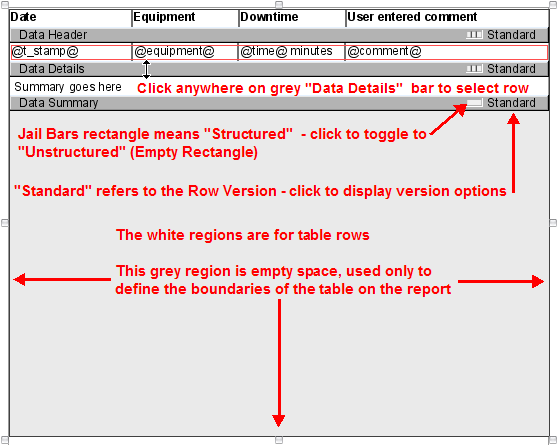
When you create a table, by default you will see something like this on the page. It says "Object Details" because it has not yet been set up to use a Data Source.
Anatomy of a Table
While not exactly complex, it's important to understand the different parts of a table and how they interact. First, the size of the component on the design page dictates how large the table can be on the generated report. Second, in this table, we have a single dark bar with the text "Object Details" on it, with four fields we can super select above. These dark bars are called Rows, we will talk about them soon.
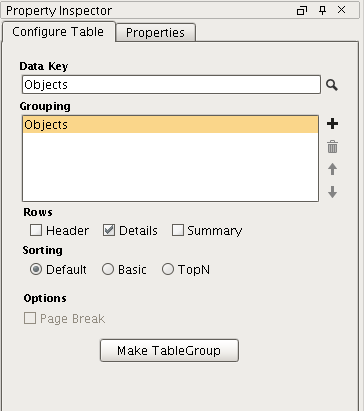
If you look at the Table Configuration panel, you will see that it has a default data key of "Objects", which matches the Details row on the component. Changing the Data Key will also change the name on the row making it easier to determine what you are looking at when editing multiple tables or Grouping.
Once you have a table in your report and have selected a Data Key for it, you can start designing. There are many tools built into the Table interface that you can use to control it's behavior or select rows and cells.
Sorting
Sorting orders your data by a key or list of keys. There are three types of Sorting in Tables.
-
Default - data is sorted based on the order in which it is retrieved.
-
Basic - takes a list of keys and sorts by the first one. If the sort results in a tie, the tie will be resolved by the next key in the list, and so on.
-
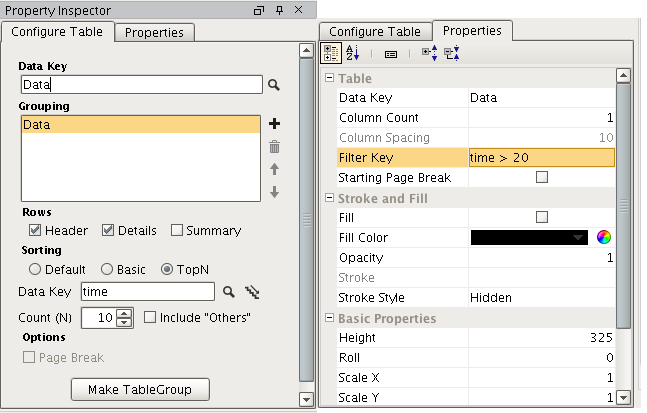
TopN - uses a single key path, with a Count value that allows a limit to the number of rows that are processed.
Basic and TopN sorts can be configured for either ascending (  ) or descending (
  ) sorts. They can also utilize aggregate (calculation) keys.
The TopN option Include Others 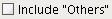 will include all values outside of the specified Count range by compressing them into a single row.
Basic Sort Example
We will look at the same table using different sorts. Both have the same exact layout (we made the first, and simply copy/paste to replicate). The first uses Default sort, the second will use a Basic Sort as configured in the image.
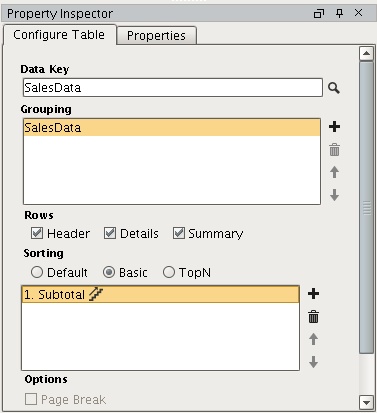
To alternate to descending, we could click the
icon and it would toggle to a descending sort.
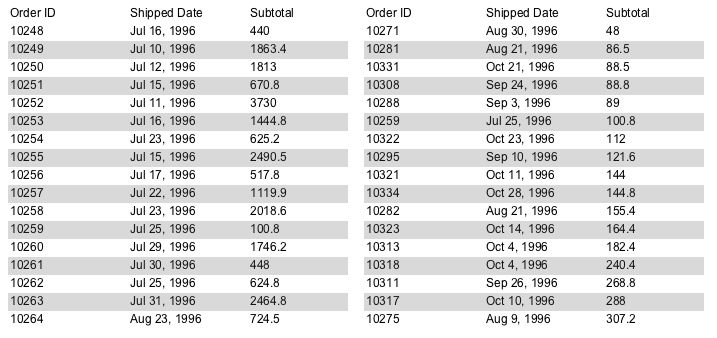
These are our resulting tables, showing the left table sorted by its primary key (OrderID) and the right sorted by Ascending Subtotal.
Filtering
Filtering gives the option of processing data based on an expression. The Filtering property can be found in the Property Inspector under the Properties tab.
If the expression resolves false, the row will be skipped. Note: you do not need @ symbols to reference keys.
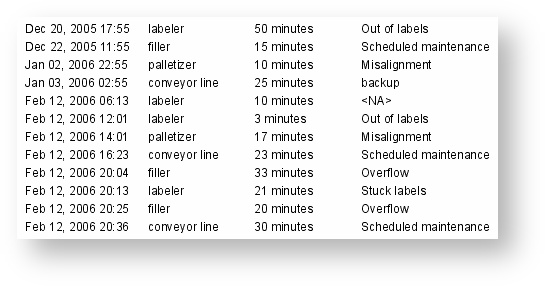
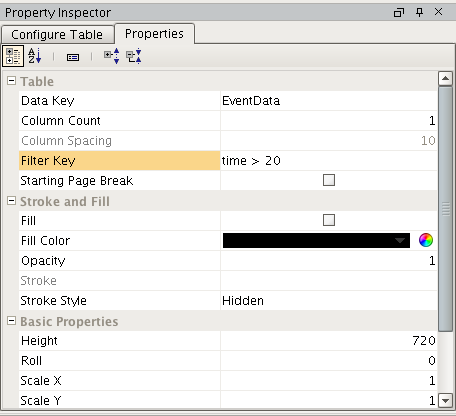
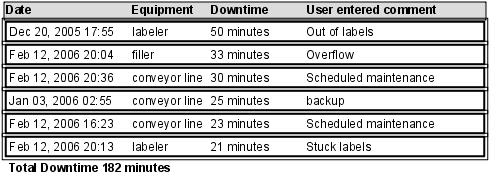
Filtered TopN Sort Example
This example is sorted descending by downtime and filtered by downtime greater than 20 minutes.
Other Table Components
There are a few other tables in the Report Module, and they all behave a little differently than the main table.
-
Simple Table : a basic table that has a set number of rows and columns that you can put static or dynamic values. You cannot use keys from a dataset in this table.
-
Labels: primarily used for printing sticker labels for inventory tracking or other systems. These reports are usually sent to a printer.
-
CrossTab : table used for displaying data with two groupings (ie: machine_name and downtime_entry) to correlate data. This table will stretch both it's height and width to accommodate the underlying dataset.
In This Section ...